Europe / Housing & income
EU overcrowding by national income threshold · 2025
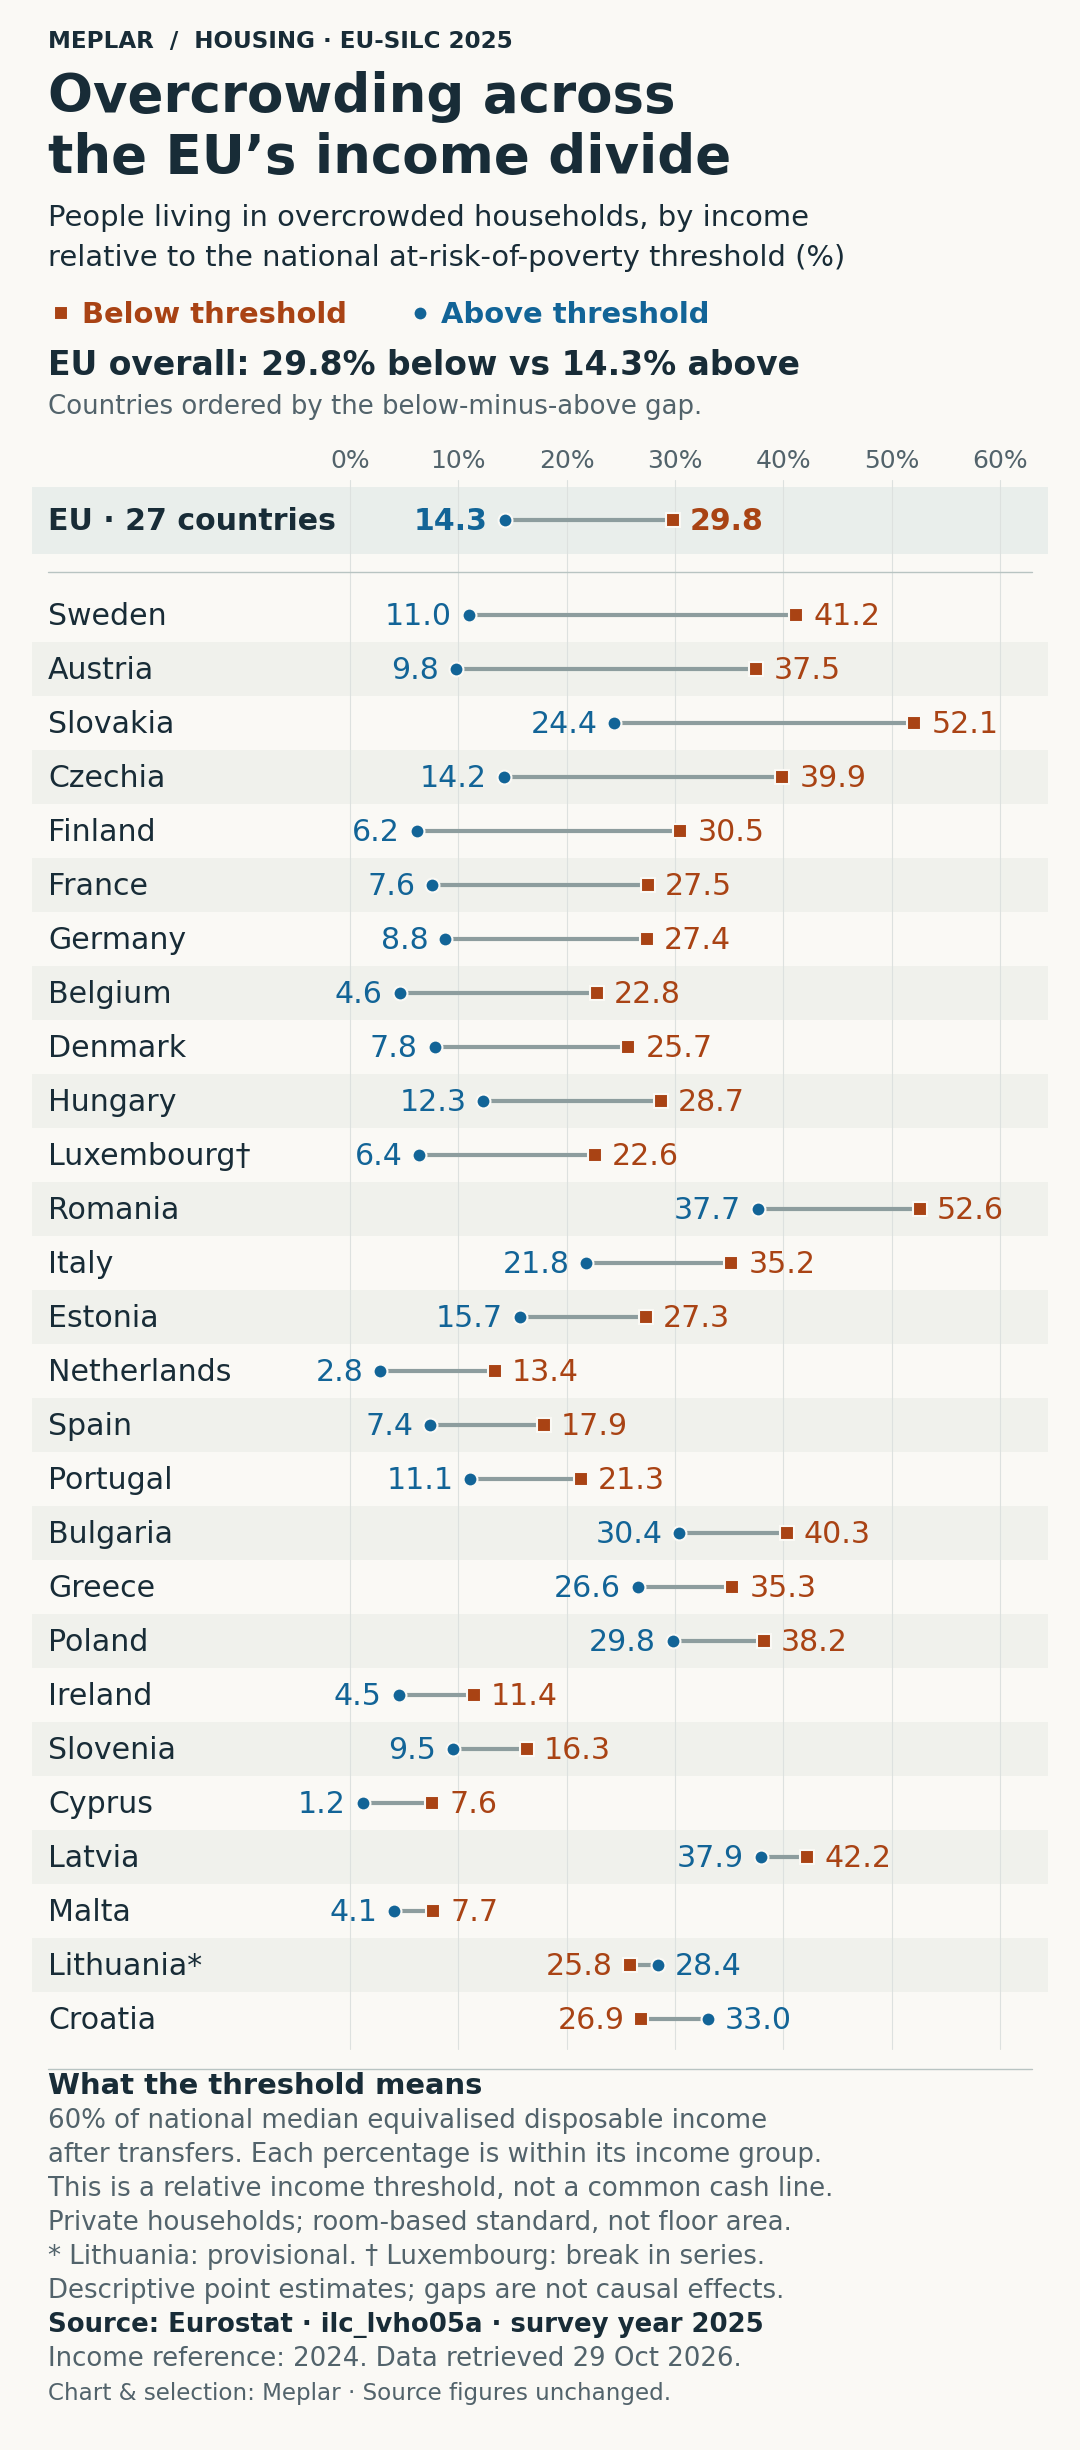
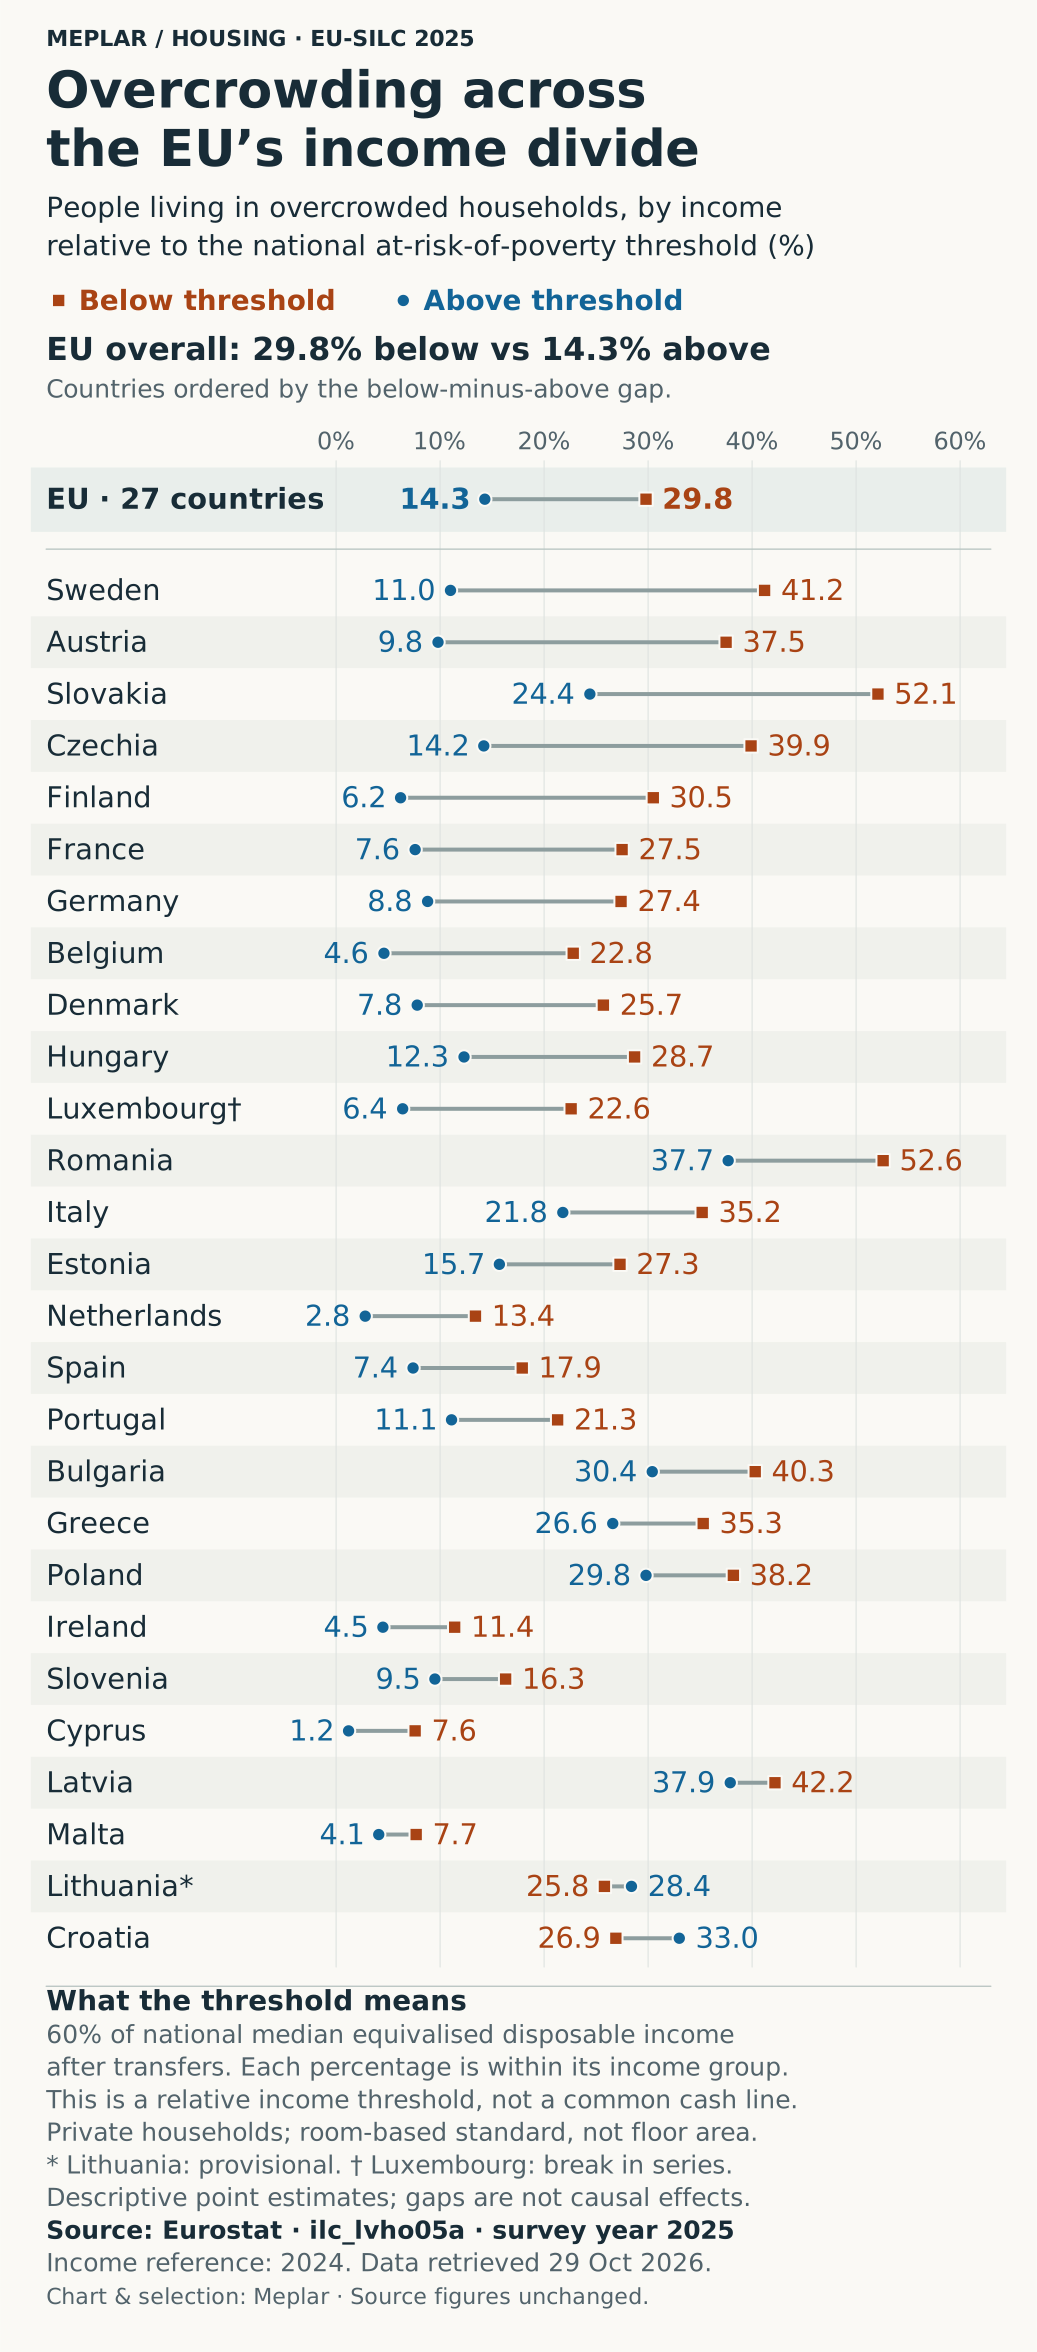
Eurostat EU-SILC 2025 overcrowding rates for all 27 EU members and the published EU aggregate, below and above the national 60% income threshold. CSV and JSON retain source flags, all-income rates and derived percentage-point gaps.
Definitions and limits
Eurostat EU-SILC survey reference year 2025; income reference year 2024. The saved source was accessed on 29 October 2026 and its updated field is 20 October 2026. These are not 2026 housing observations.
Each percentage describes people within the specified income group living in overcrowded private households. The threshold is 60% of national median equivalised disposable income after social transfers. Countries do not share a common cash poverty line. Source categories are Above 60% (A_60) and Below 60% (B_60); no additional endpoint convention is inferred.
Overcrowding follows Eurostat’s room-based standard for household size and composition. It is not a measure of floor area, urban density, rents or homelessness. Collective and institutional households and people without private-household accommodation are generally outside EU-SILC coverage.
All 27 EU member countries are shown. The EU row is Eurostat’s separately published EU27_2020 aggregate, not an unweighted country mean. Countries are ordered by the below-minus-above percentage-point gap; source rates are unchanged and no values are interpolated.
Lithuania is provisional (p) in all three series. Luxembourg has a break-in-time-series flag (b) in all three series; this chart does not compare years. The dataset-linked Hungary note concerns 2019–2024 revisions and does not identify a separate flag for this 2025 cross-section.
These are descriptive point estimates, not causal effects. Sampling uncertainty and differences in household composition, age, tenure and other characteristics may affect comparisons. No confidence intervals are supplied in this extraction; no statistically significant ranking or universal income relationship is claimed. Croatia and Lithuania have reverse-direction comparisons.
Source: Eurostat, ilc_lvho05a, accessed 29 October 2026. Meplar selected the EU observations, calculated the gap and created the visualisation. Eurostat is not responsible for the selection, calculations, visualisation or commentary. The public JSON-stat snapshot is an explicitly labelled EU-only modification of the original response; the original hash is retained in provenance.
Fields and source snapshot
chart-data.csv and chart-data.json contain 28 rows with geo, country, year, total_pct, above_threshold_pct, below_threshold_pct, gap_pp, total_flag, above_flag and below_flag. Rates are percentages; the gap is percentage points. Blank flags mean no observation flag in the saved source, not a guarantee of precision.
eurostat-eu27-snapshot.json retains all 84 selected source rates and their flags in JSON-stat form. It is explicitly modified to omit non-EU geographies and remap indices; it is not the original HTTP response. No source rates or flags are changed.
All 27 countries and the published EU aggregate
| Country | Below (%) | Above (%) | Gap (pp) |
|---|---|---|---|
| EU · 27 countries | 29.8 | 14.3 | +15.5 |
| Sweden | 41.2 | 11.0 | +30.2 |
| Austria | 37.5 | 9.8 | +27.7 |
| Slovakia | 52.1 | 24.4 | +27.7 |
| Czechia | 39.9 | 14.2 | +25.7 |
| Finland | 30.5 | 6.2 | +24.3 |
| France | 27.5 | 7.6 | +19.9 |
| Germany | 27.4 | 8.8 | +18.6 |
| Belgium | 22.8 | 4.6 | +18.2 |
| Denmark | 25.7 | 7.8 | +17.9 |
| Hungary | 28.7 | 12.3 | +16.4 |
| Luxembourg† | 22.6 | 6.4 | +16.2 |
| Romania | 52.6 | 37.7 | +14.9 |
| Italy | 35.2 | 21.8 | +13.4 |
| Estonia | 27.3 | 15.7 | +11.6 |
| Netherlands | 13.4 | 2.8 | +10.6 |
| Spain | 17.9 | 7.4 | +10.5 |
| Portugal | 21.3 | 11.1 | +10.2 |
| Bulgaria | 40.3 | 30.4 | +9.9 |
| Greece | 35.3 | 26.6 | +8.7 |
| Poland | 38.2 | 29.8 | +8.4 |
| Ireland | 11.4 | 4.5 | +6.9 |
| Slovenia | 16.3 | 9.5 | +6.8 |
| Cyprus | 7.6 | 1.2 | +6.4 |
| Latvia | 42.2 | 37.9 | +4.3 |
| Malta | 7.7 | 4.1 | +3.6 |
| Lithuania* | 25.8 | 28.4 | −2.6 |
| Croatia | 26.9 | 33.0 | −6.1 |
* Lithuania: provisional. † Luxembourg: break in time series. Flags apply to total, above and below series. The all-income rate is also retained in the CSV.
Offline reproduction
Unpack the ZIP into an empty directory and run python3 reproduce.py --out reproduced. The standard library reconstructs both data files from the saved EU-only JSON-stat snapshot. Optional --render-png rebuilds the SVG and PNG layouts using an existing Python environment with matplotlib/Pillow and librsvg. No network, credentials or package installation is attempted. See the README for the tested rendering environment.
- README.md · text/markdown · 2426 bytes
- SHA256SUMS.txt · text/plain · 1153 bytes
- SOURCE_PROVENANCE.json · application/json · 1972 bytes
- SOURCE_TERMS.txt · text/plain · 832 bytes
- chart-data.csv · text/csv · 1244 bytes
- chart-data.json · application/json · 6851 bytes
- chart.png · image/png · 401859 bytes
- chart.svg · image/svg+xml · 52509 bytes
- chart_mobile.png · image/png · 403275 bytes
- chart_mobile.svg · image/svg+xml · 26511 bytes
- eurostat-eu27-snapshot.json · application/json · 8522 bytes
- metadata.json · application/json · 4651 bytes
- render-validation.json · application/json · 449 bytes
- render_chart.py · text/x-python · 10479 bytes
- reproduce.py · text/x-python · 1940 bytes
- source-and-data.zip · application/zip · 787155 bytes


Original sources and reuse
- Eurostat dataset: overcrowding by age, sex and poverty status (ilc_lvho05a)
- Eurostat dataset DOI
- Eurostat definition of overcrowding and full room rules
- Eurostat at-risk-of-poverty rate definition
- EU-SILC metadata: reference periods, coverage and uncertainty
- Dataset-linked Hungary information note, 2019–2024 revisions
- Eurostat copyright notice and data reuse conditions
Source: Eurostat, accessed 29 October 2026. Chart, selection and gap calculations by Meplar. Eurostat is not responsible for this adaptation. See source terms and source provenance.