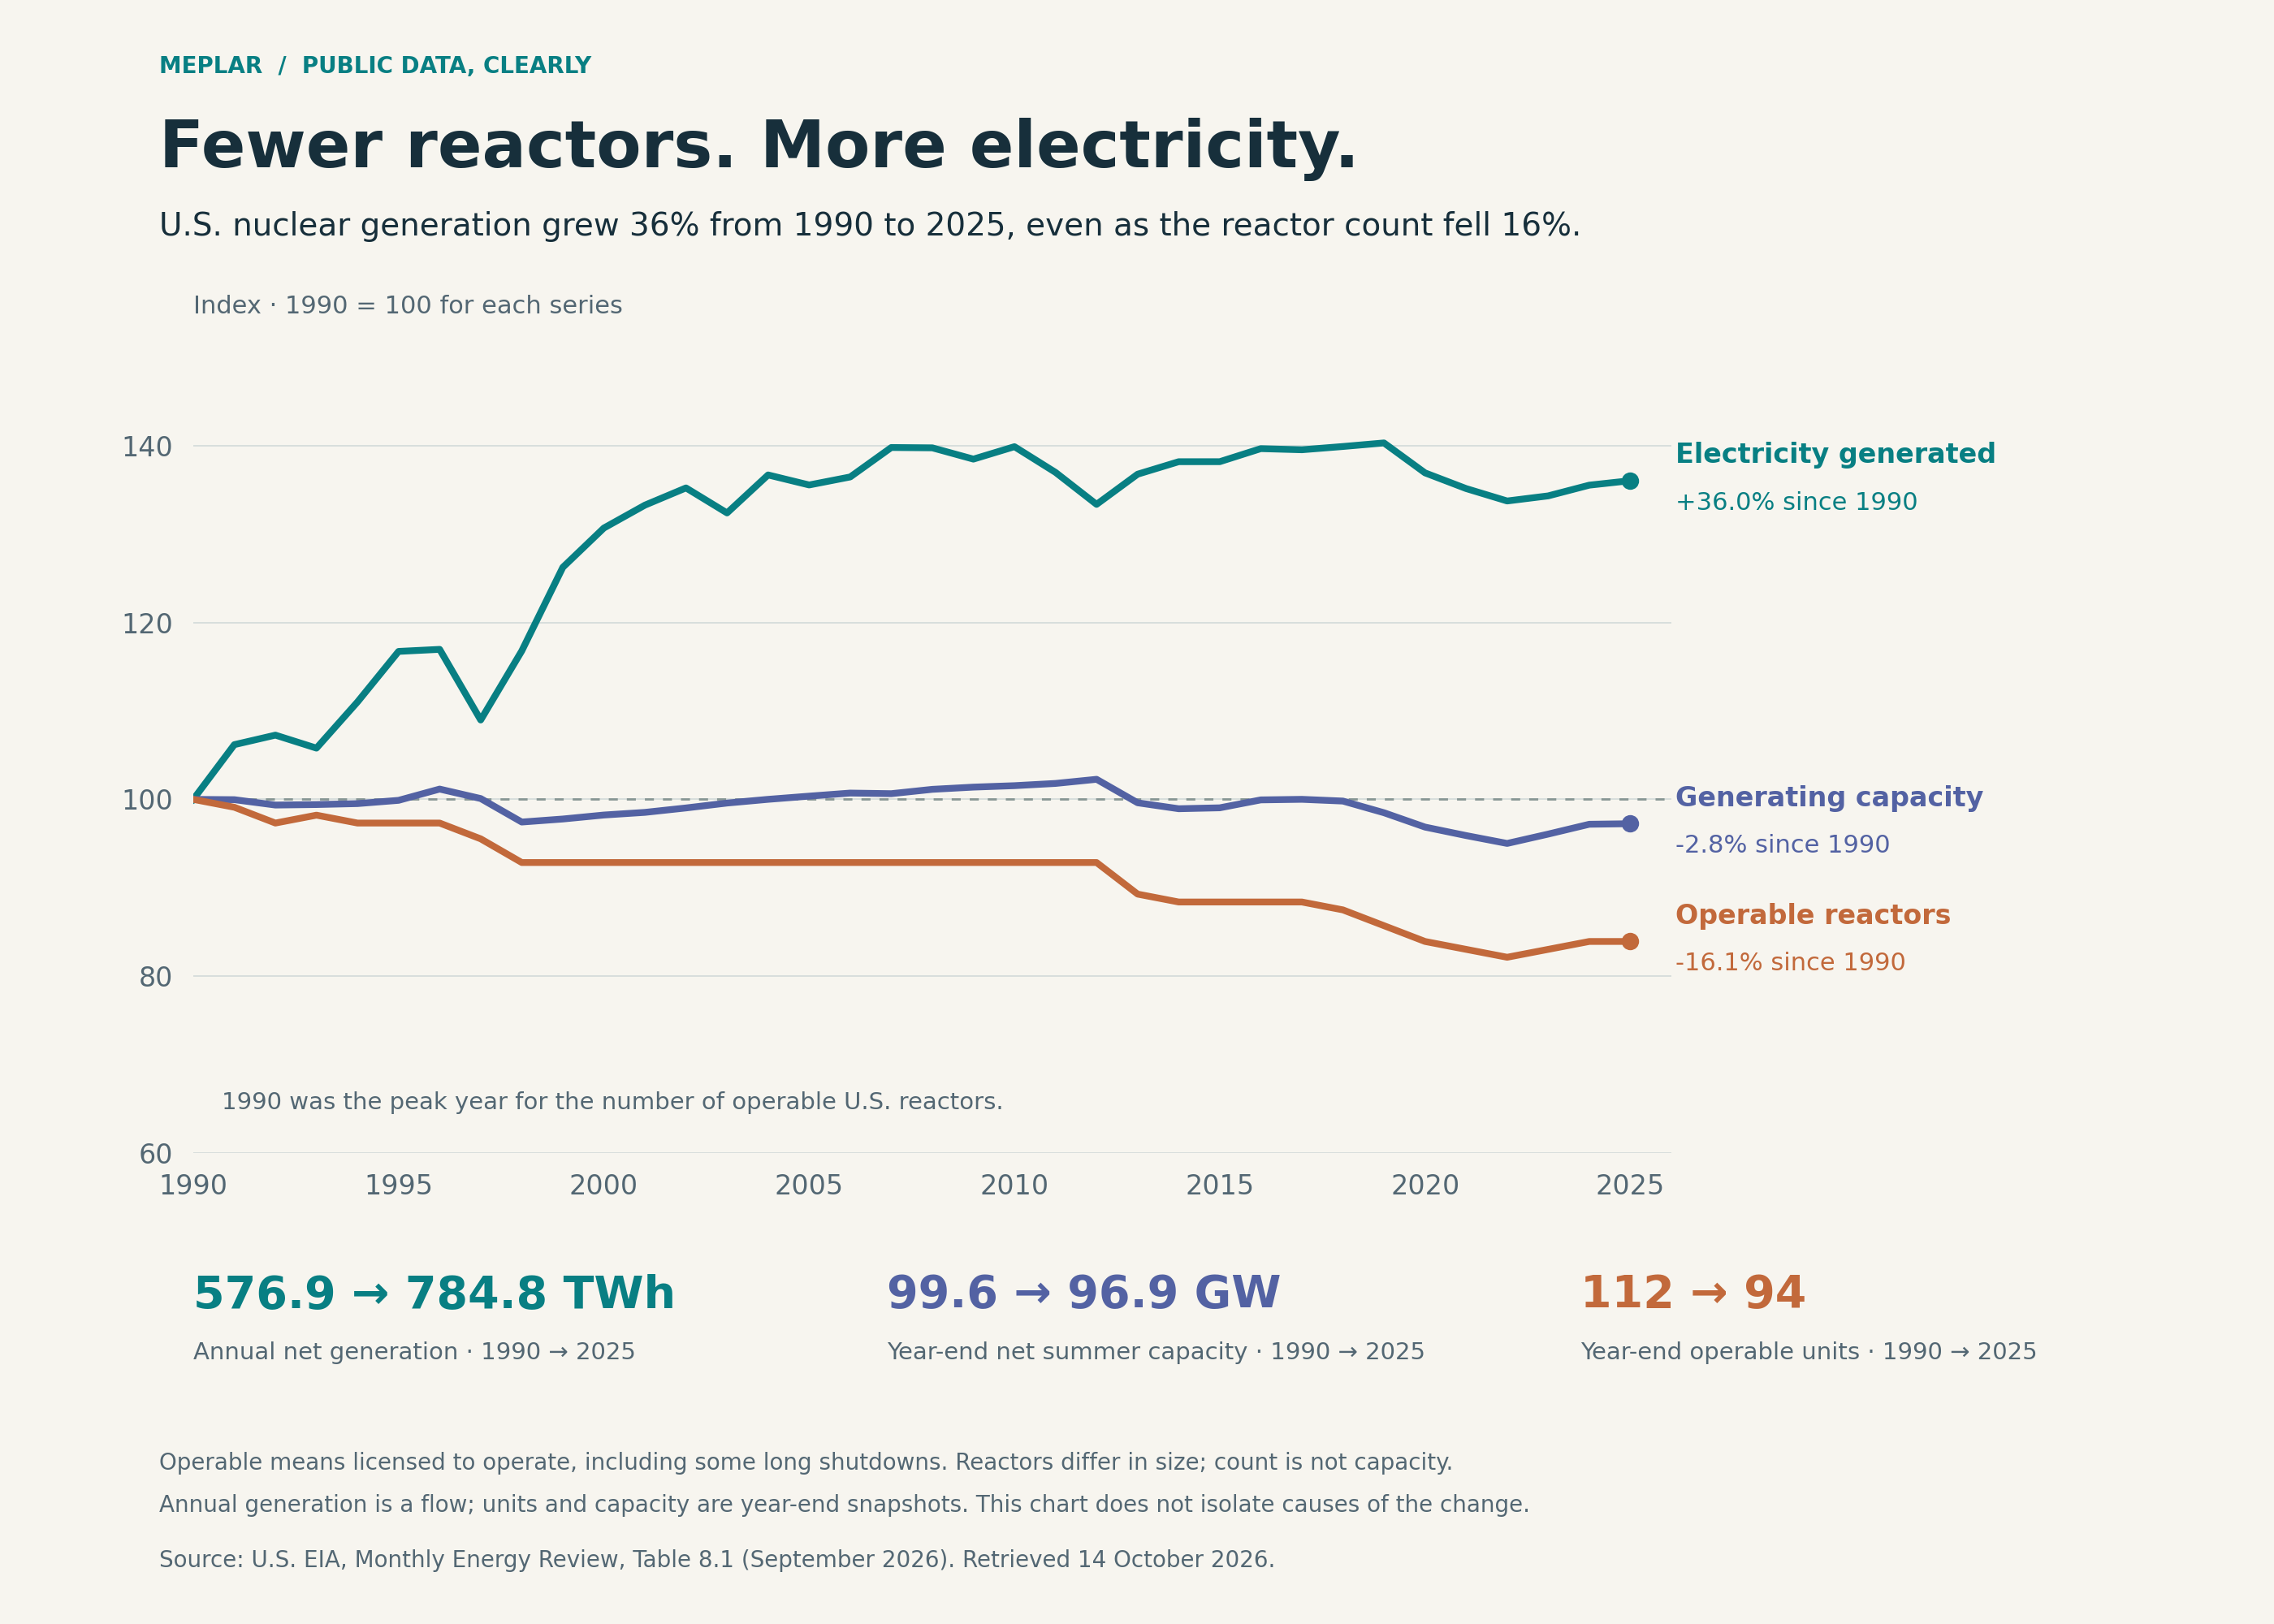
US nuclear electricity, units and capacity
Annual US nuclear net generation, year-end operable units and net summer capacity from EIA, with a 1990-based chart series.
- 50 US states and Washington, DC; chart 1990–2025; full annual series 1957–2025.
- Snapshot: 14 October 2026 · Free CSV + ZIP
ZIP includes frozen inputs, complete reproduction files, reviewed chart variants, source attribution and method notes.
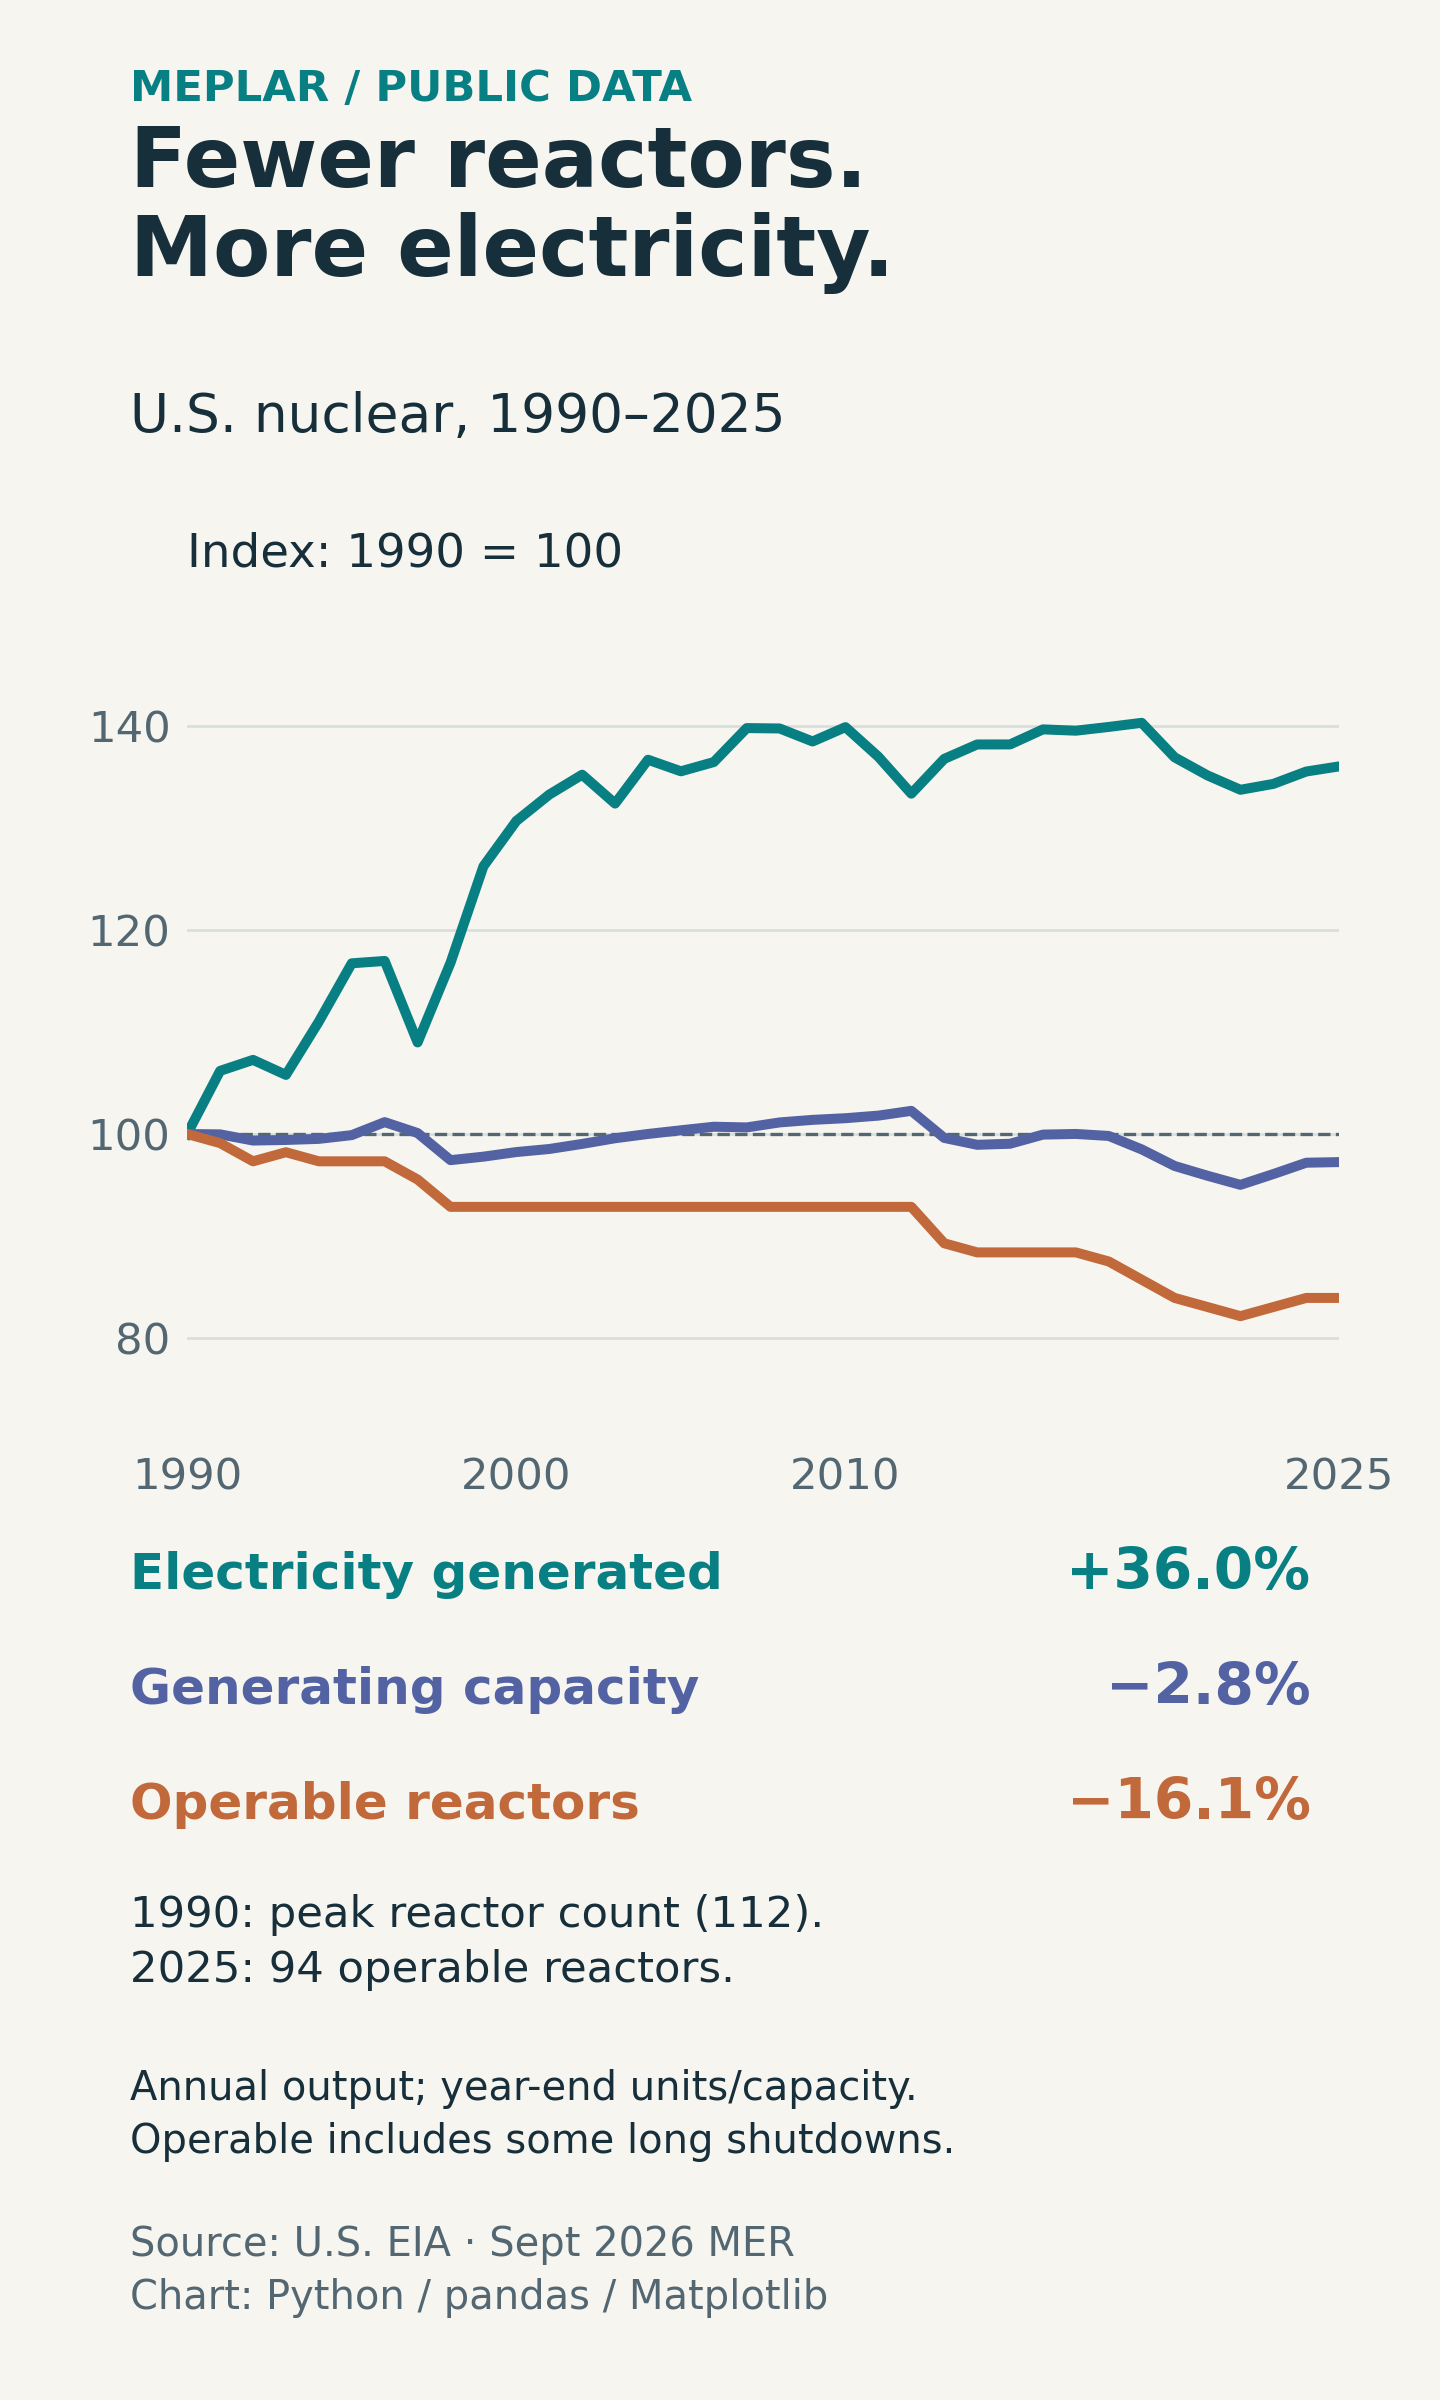
View chart