Great Britain / Work & income
Hybrid work by occupation and personal income · Great Britain, Jan–Mar 2025
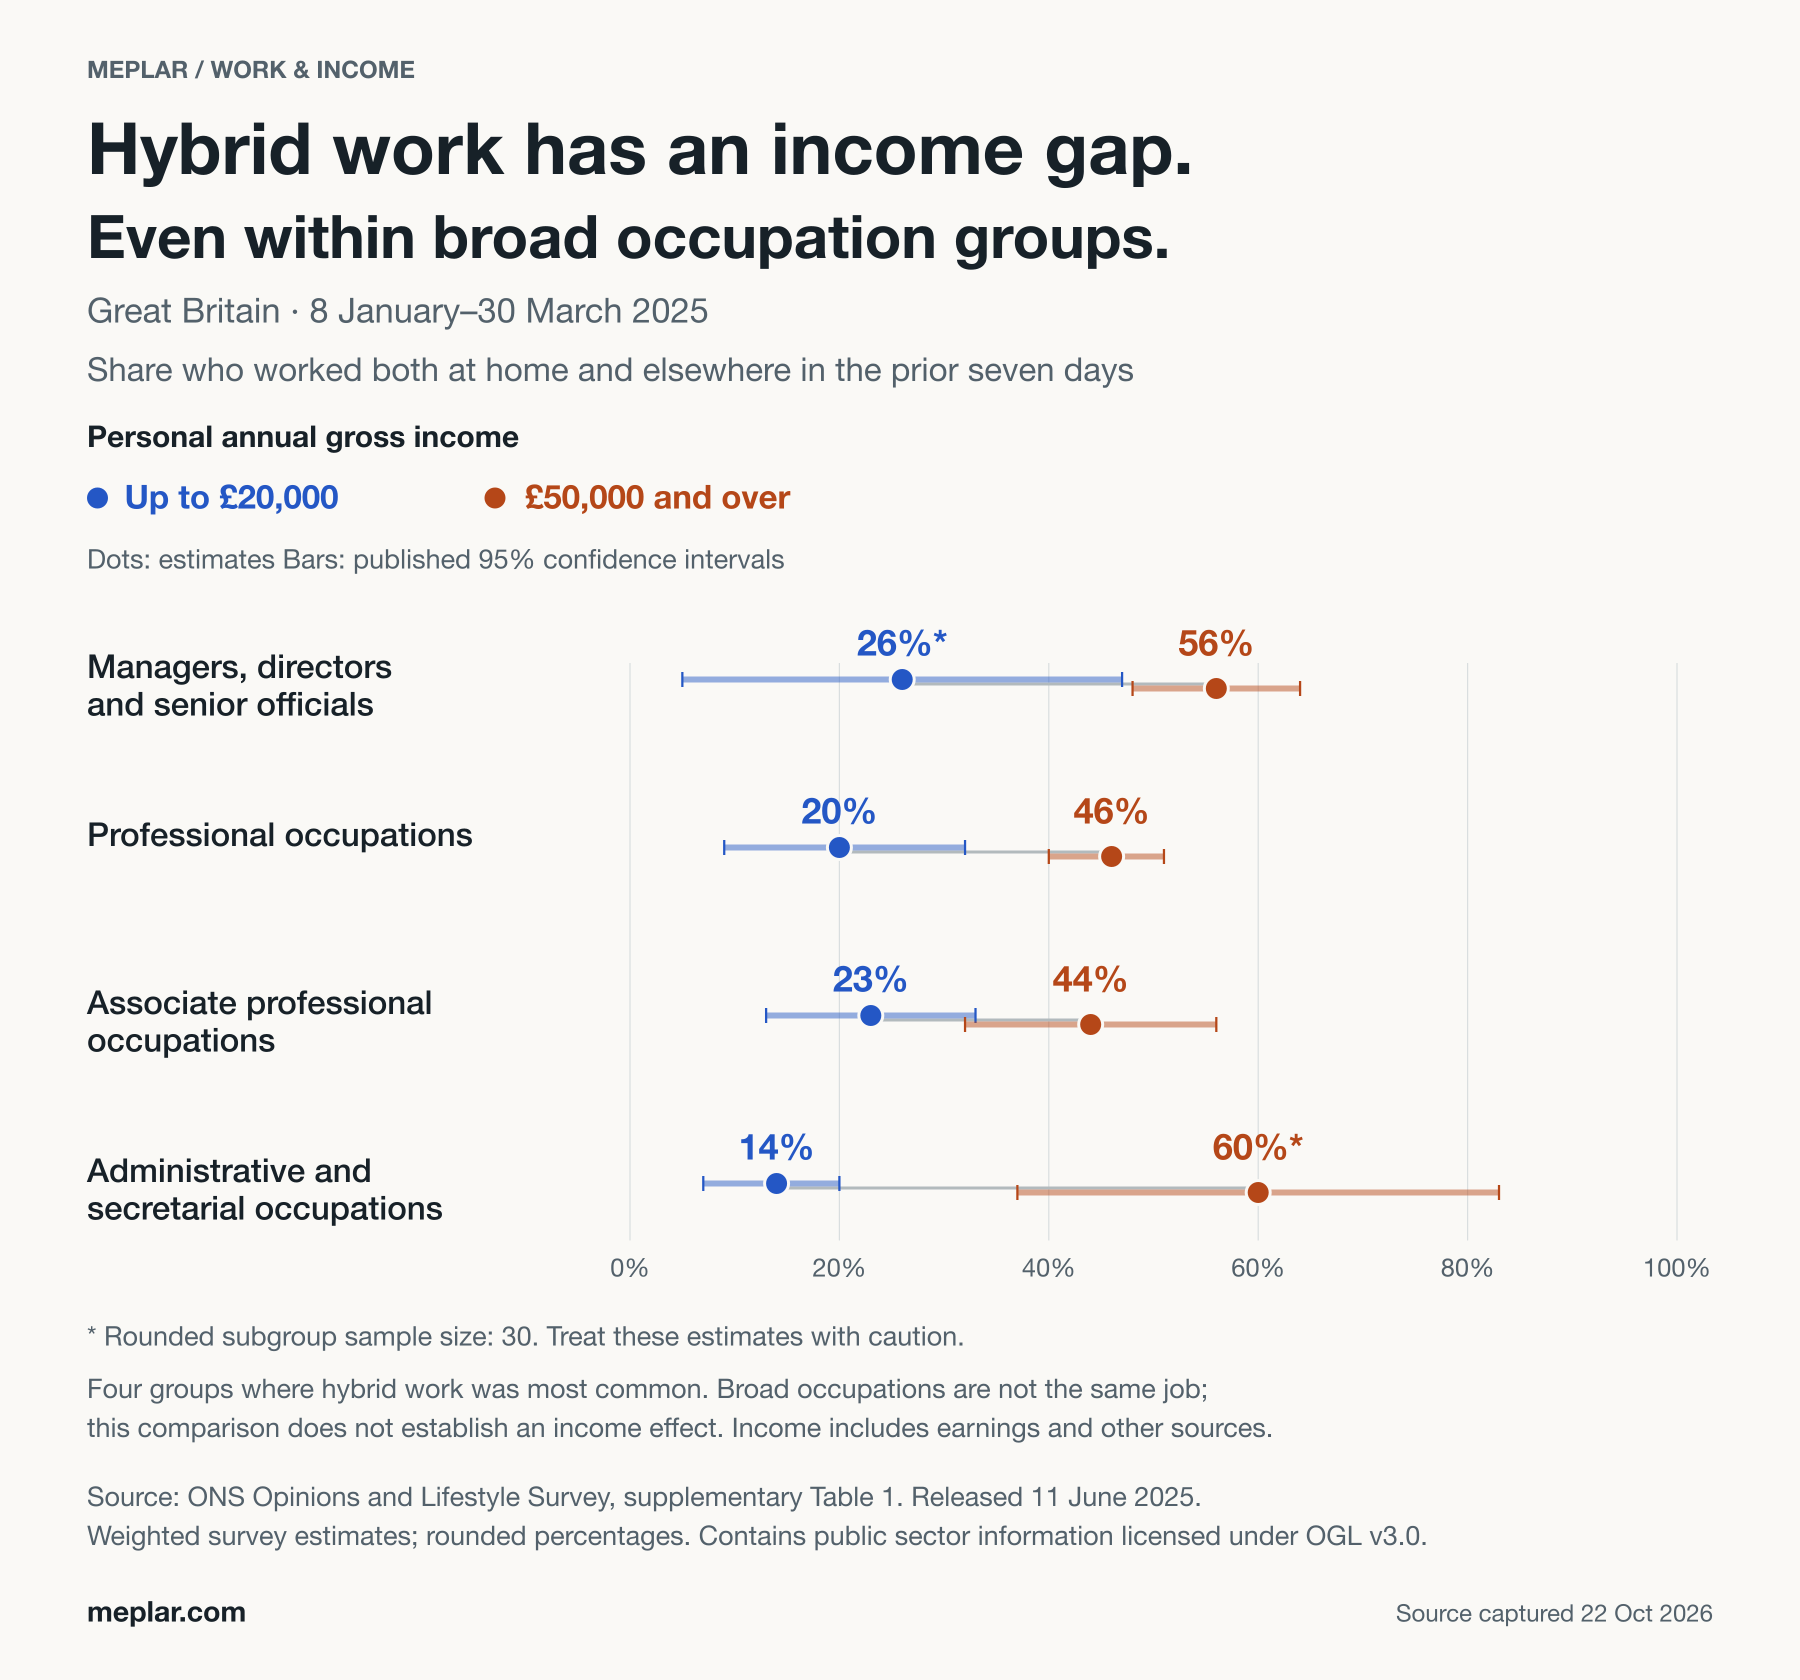
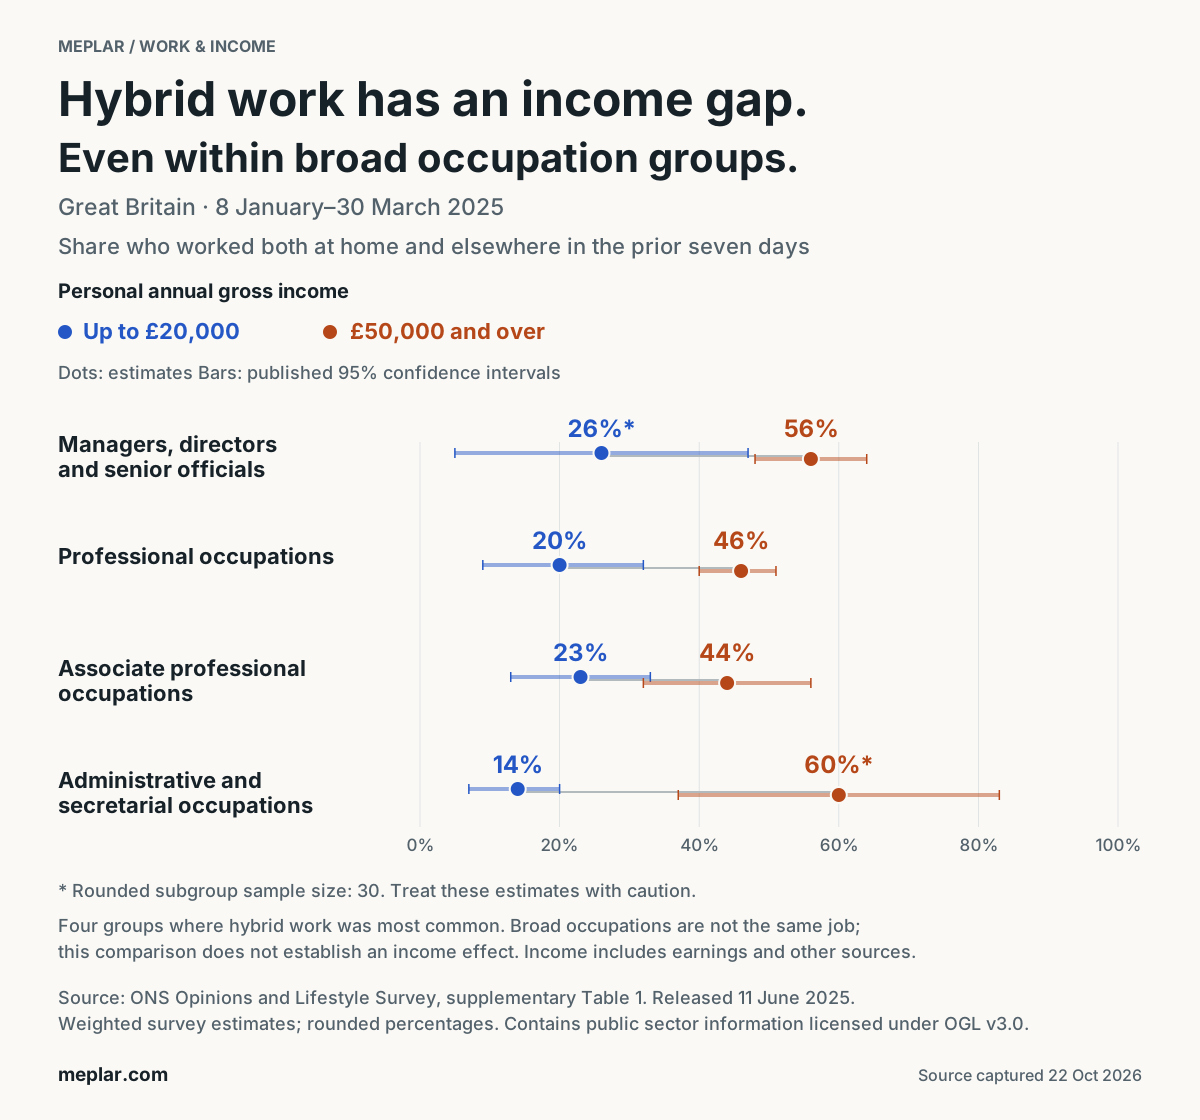
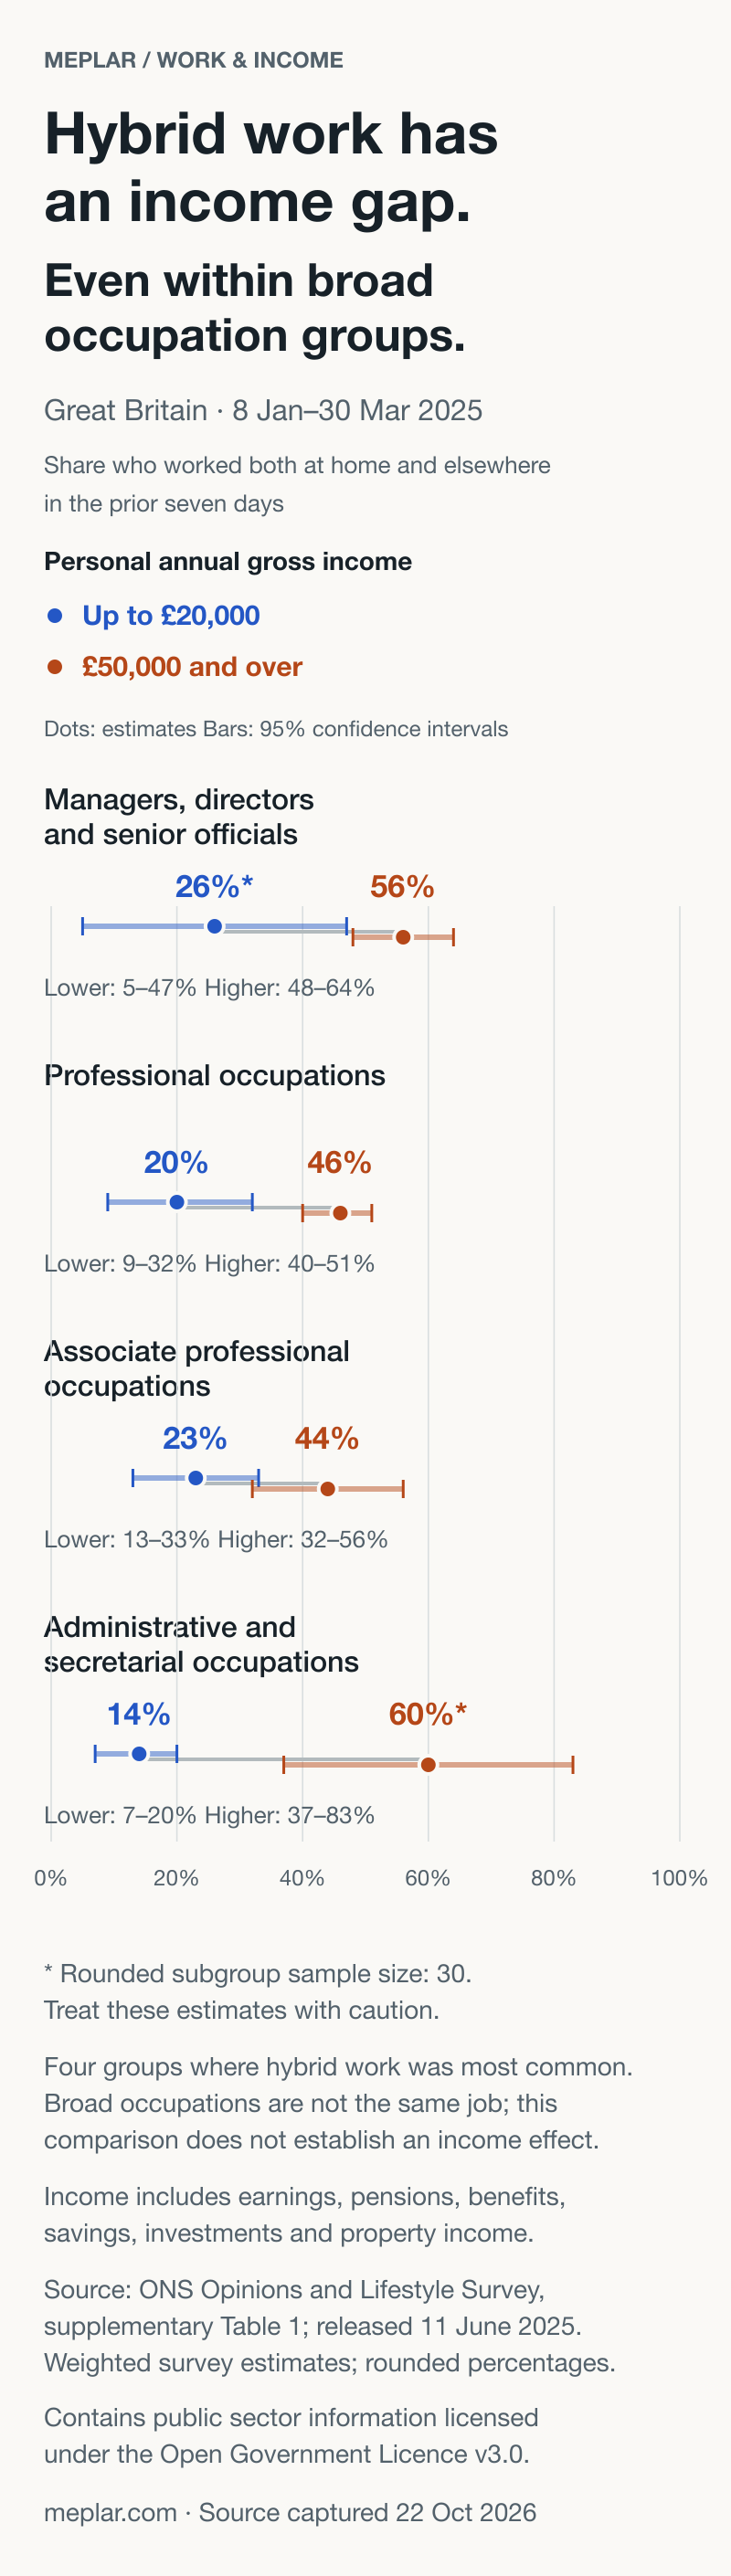
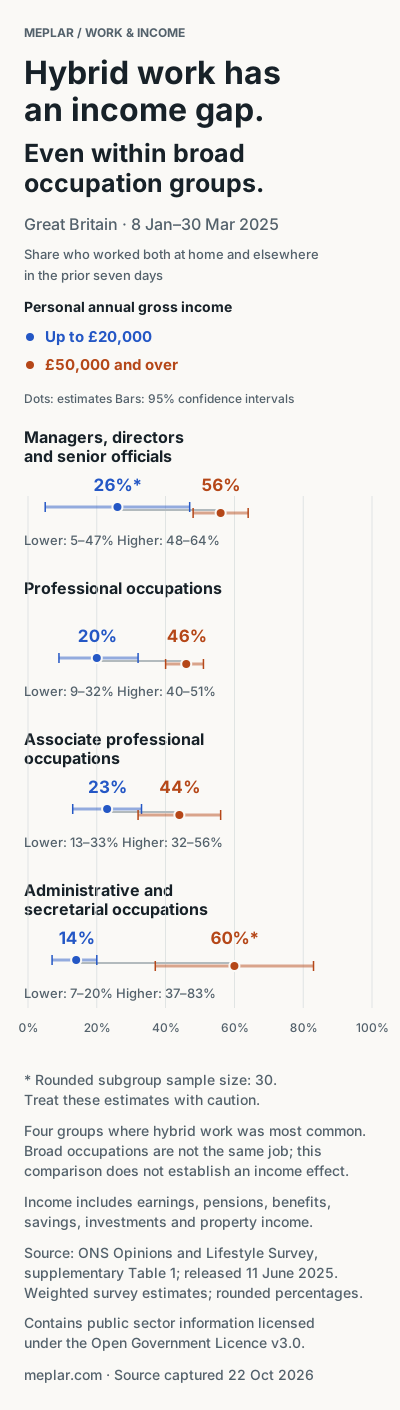
ONS survey estimates for Great Britain, 8 January–30 March 2025, show higher hybrid-work shares in the £50,000-and-over personal-income band than in the up-to-£20,000 band across four broad occupation groups. Published uncertainty intervals and small-sample cautions are shown.
Definitions and limits
Weighted Opinions and Lifestyle Survey estimates for working adults aged 16 and over living in Great Britain, 8 January–30 March 2025; release 11 June 2025. These are historical survey-period figures, not current October 2026 rates.
Hybrid means Yes to both worked from home and travelled to work in the previous seven days. The measure includes regular and irregular patterns; respondents answering Don’t know or Prefer not to say to either question are excluded. The denominator includes the employed-but-did-not-work category.
Personal annual gross income is self-reported and includes earnings, pensions, benefits, savings, investments and property income. It is neither salary alone nor equivalised household income.
Use the workbook label Up to £20,000 for the lower band and £50,000 and over for the higher band. The bulletin prose describes the lower band as under £20,000; the chart retains the exact published workbook label without inventing an endpoint interpretation.
Select the four broad SOC occupation groups identified in the ONS bulletin as having the highest hybrid-work shares. These are broad groups, not matched employees or the same job. Income, occupation and working arrangements are self-reported. This descriptive comparison does not establish an income effect or explain causes.
Point estimates and 95% confidence intervals are copied unchanged from Table_1 columnsD–F. Sample sizes are copied from columnG and rounded by ONS to the nearest 10. Sample size is the subgroup denominator, not the number of hybrid respondents. Estimates based on 30 or fewer should be treated with caution: lower-income managers and higher-income administrative/secretarial groups both show 30.
Confidence intervals are displayed for each estimate. Associate professional intervals overlap:13–33% and 32–56%. No claim that all four differences are statistically significant; no confidence interval for a difference is calculated. Point gaps 30/26/21/46 percentage points subtract rounded estimates only.
The tidy chart CSV has 8 observations. The paired CSV has 4 occupation rows with both estimates, intervals, sample sizes, source coordinates and point gaps. The full Table_1 extract has 224 rows and retains suppression markers as strings; none of the 8 selected observations is suppressed. No missing values are filled, no estimates reweighted, and no interpolation is performed.
Contains public sector information licensed under the Open Government Licence v 3.0. Source: Office for National Statistics, Opinions and Lifestyle Survey,11 June 2025. Chart and selection by Meplar; no ONS endorsement implied. No ONS logo, photograph or third-party illustration reused.
CSV fields and files
chart-data.csv has eight occupation × income observations with hybrid_share_pct, ci95_low_pct, ci95_high_pct, rounded subgroup sample size and source row. The paired file has four occupation rows; the full Table_1 extract retains 224 rows, including suppression markers.
All eight occupation and income estimates
| Occupation | Personal income | Estimate | 95% interval |
|---|---|---|---|
| Managers, directors and senior officials | Up to £20,000 | 26%* | 5–47% |
| Managers, directors and senior officials | £50,000 and over | 56% | 48–64% |
| Professional occupations | Up to £20,000 | 20% | 9–32% |
| Professional occupations | £50,000 and over | 46% | 40–51% |
| Associate professional occupations | Up to £20,000 | 23% | 13–33% |
| Associate professional occupations | £50,000 and over | 44% | 32–56% |
| Administrative and secretarial occupations | Up to £20,000 | 14% | 7–20% |
| Administrative and secretarial occupations | £50,000 and over | 60%* | 37–83% |
Reproduction
Unpack the ZIP into an empty directory and run python3 reproduce.py --out reproduced. The standard library rebuilds the three CSVs and two SVGs offline. Optional --render-png requires the existing librsvg executable and matching fonts. No network, credentials or new packages are required.
- README.md · text/markdown · 4325 bytes
- SHA256SUMS.txt · text/plain · 1086 bytes
- SOURCE_PROVENANCE.json · application/json · 3324 bytes
- SOURCE_TERMS.txt · text/plain · 697 bytes
- chart-data.csv · text/csv · 1135 bytes
- chart.png · image/png · 352800 bytes
- chart.svg · image/svg+xml · 9322 bytes
- chart_mobile.png · image/png · 384377 bytes
- chart_mobile.svg · image/svg+xml · 10745 bytes
- hybrid-income-by-occupation.csv · text/csv · 1550 bytes
- metadata.json · application/json · 5516 bytes
- ons-table1-source-extract.csv · text/csv · 32026 bytes
- reproduce.py · text/x-python · 14058 bytes
- source-and-data.zip · application/zip · 826927 bytes
Original sources and reuse
- ONS, Who has access to hybrid work in Great Britain? Section4 and glossary
- ONS supplementary tables, Table_1; cover and notes
- ONS dataset release page
- ONS terms and reuse policy
See source terms and source provenance for attribution and capture details.