United States · Economy · Dataset
U.S. food prices, month by month.
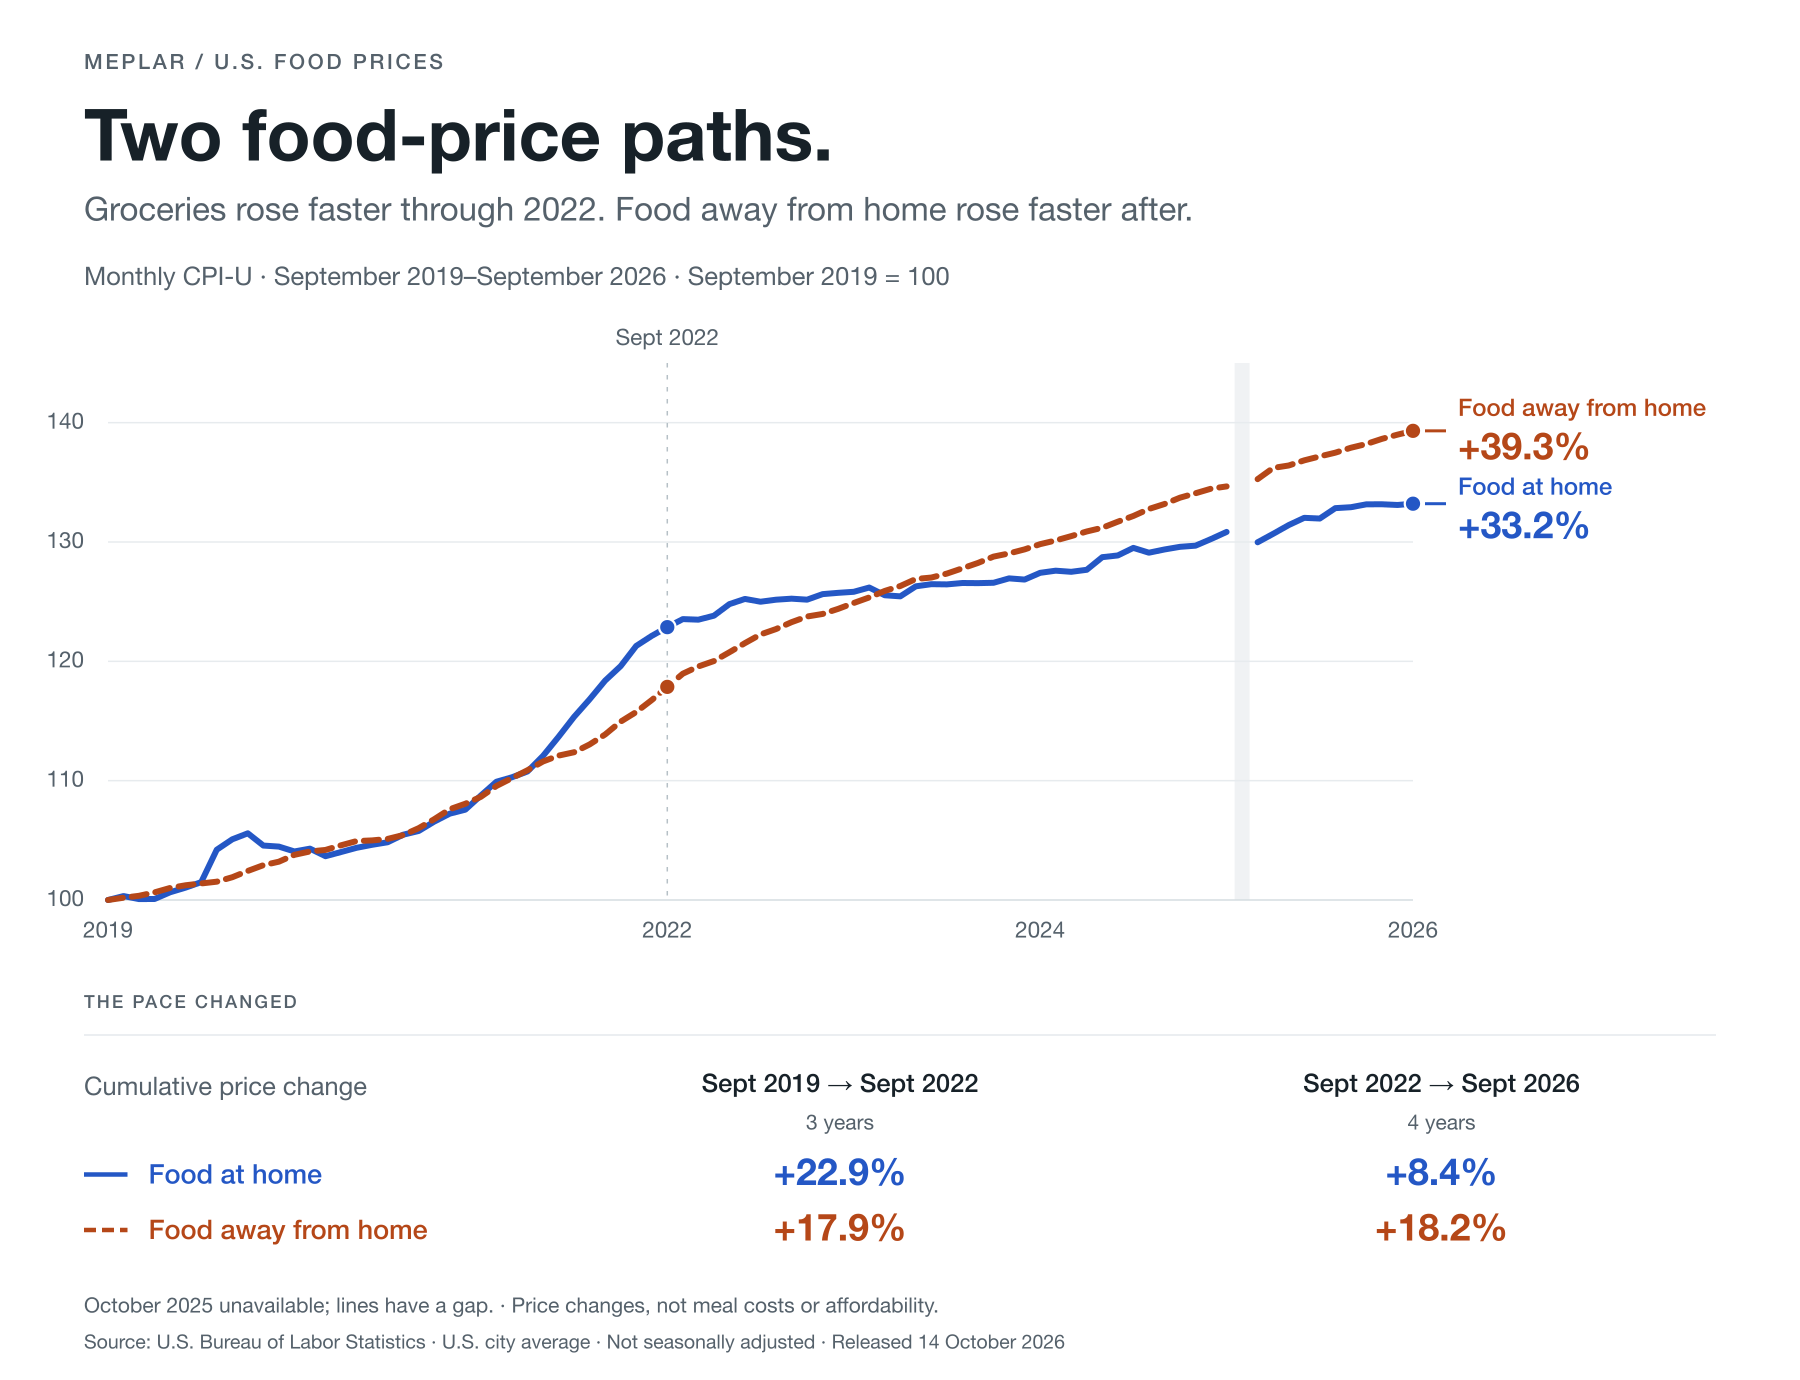
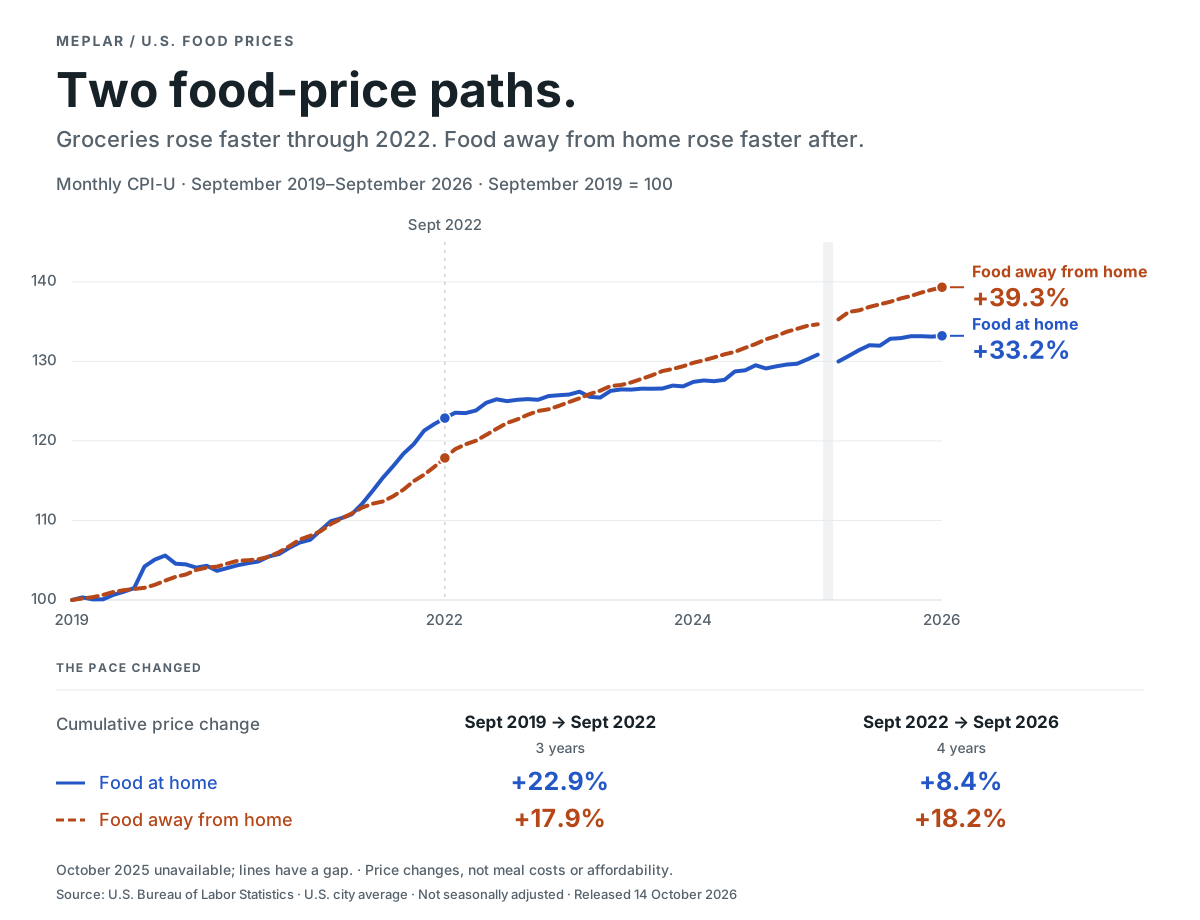
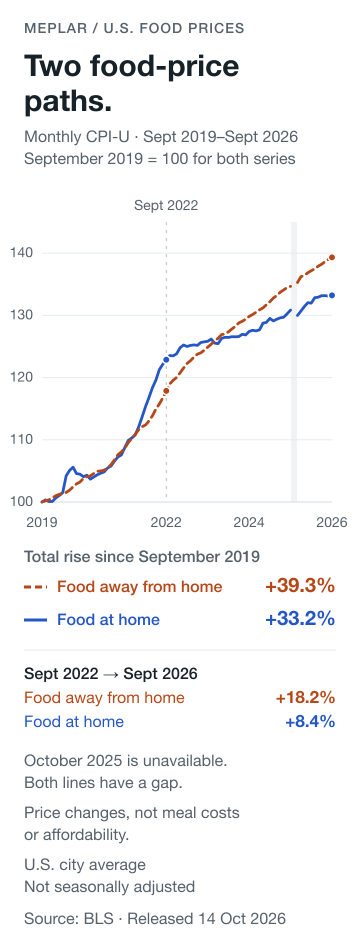
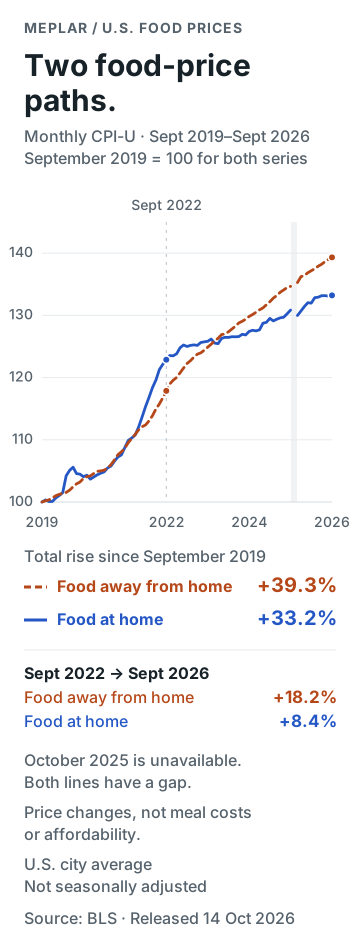
Monthly BLS CPI-U food-at-home and food-away-from-home series for the U.S. city average, September 2019–September 2026; original and rebased levels, missing-value flags and cumulative period calculations.
Methods and limits
CPI-U, U.S. city average, all urban consumers; monthly, not seasonally adjusted. The source base is 1982–84 = 100. Each series is separately rebased to September 2019 = 100.
85 monthly slots from September 2019 to September 2026; 170 extracted series-month rows contain 168 observed CPI values and two missing October 2025 cells (BLS code X). No interpolation or carry-forward; both lines break across the missing month.
Cumulative endpoint changes use unrounded source values and one-decimal display. September 2019–2022 spans 3 years; September 2022–2026 spans 4 years. These are period totals, not annualized rates.
Food away from home includes restaurants, takeout, school and workplace meals, vending, mobile vendors and catering. The national series are broader than restaurants and do not represent every household or city.
Price indexes show changes, not dollar meal costs, spending, wages, affordability or causes. A shared starting index does not mean equivalent meal baskets cost the same.
BLS published the September 2026 release on 14 October 2026. Frozen source files were retrieved on 18 October 2026. These are source dates, not a Meplar publication date.
Rebasing: 100 × CPI(month) / CPI(September 2019). Cumulative change: 100 × (CPI(end) / CPI(start) − 1). Annual-average M13 rows are excluded. The original source values retain their reported precision; the rebased CSV uses nine decimal places.
Monthly CSV fields
| Field | Meaning |
|---|---|
month | YYYY-MM; 85 consecutive monthly slots. |
food_at_home_cpi_1982_84_100 | Original food-at-home CPI-U; 1982–84 = 100. |
food_away_cpi_1982_84_100 | Original food-away-from-home CPI-U; 1982–84 = 100. |
food_at_home_sept_2019_100 | Food-at-home index rebased to September 2019 = 100. |
food_away_sept_2019_100 | Food-away-from-home index rebased to September 2019 = 100. |
footnote_code | X for the two unavailable October 2025 source values; blank otherwise. |
source-extract.csv contains 170 series-month rows, preserving original value strings, series IDs and footnotes. period-changes.csv contains three endpoint comparisons with both percent changes and explicit 3-, 4- and 7-year spans.
Files and reproducibility
The ZIP bundles the four frozen BLS captures, the three data tables, exact reviewed artwork, source provenance, checksums and a standard-library Python script. The script rebuilds the CSVs and verifies the frozen chart exports; it does not recreate PNG rendering.
- README.md · text/markdown · 3,941 bytes
- SHA256SUMS.txt · text/plain · 1,059 bytes
- SOURCE_PROVENANCE.json · application/json · 2,257 bytes
- SOURCE_TERMS.txt · text/plain · 1,039 bytes
- chart.png · image/png · 225,326 bytes
- chart.svg · image/svg+xml · 9,740 bytes
- chart_mobile.png · image/png · 90,905 bytes
- chart_mobile.svg · image/svg+xml · 9,314 bytes
- metadata.json · application/json · 6,221 bytes
- monthly.csv · text/csv · 4,592 bytes
- period-changes.csv · text/csv · 150 bytes
- reproduce.py · text/x-python · 11,081 bytes
- source-and-data.zip · application/zip · 1,390,014 bytes
- source-extract.csv · text/csv · 5,388 bytes
Original sources and reuse
- U.S. Bureau of Labor Statistics, CPI-U food series
- BLS series definitions
- BLS missing-value footnote codes
- Archived September 2026 CPI release (14 October 2026)
- BLS CPI concepts
- BLS reuse policy
BLS federal publications and data may be reused under its public-domain policy, subject to the policy’s exceptions for pre-existing copyrighted images. Please attribute BLS for the source data and Meplar for the chart. No BLS emblem appears in the chart. The agency’s emblem remains protected; the data reuse statement does not grant rights to it or invent a license for Meplar artwork. See source terms and capture provenance.