Food & everyday life / United States

After 2022, prices rose faster away from home.

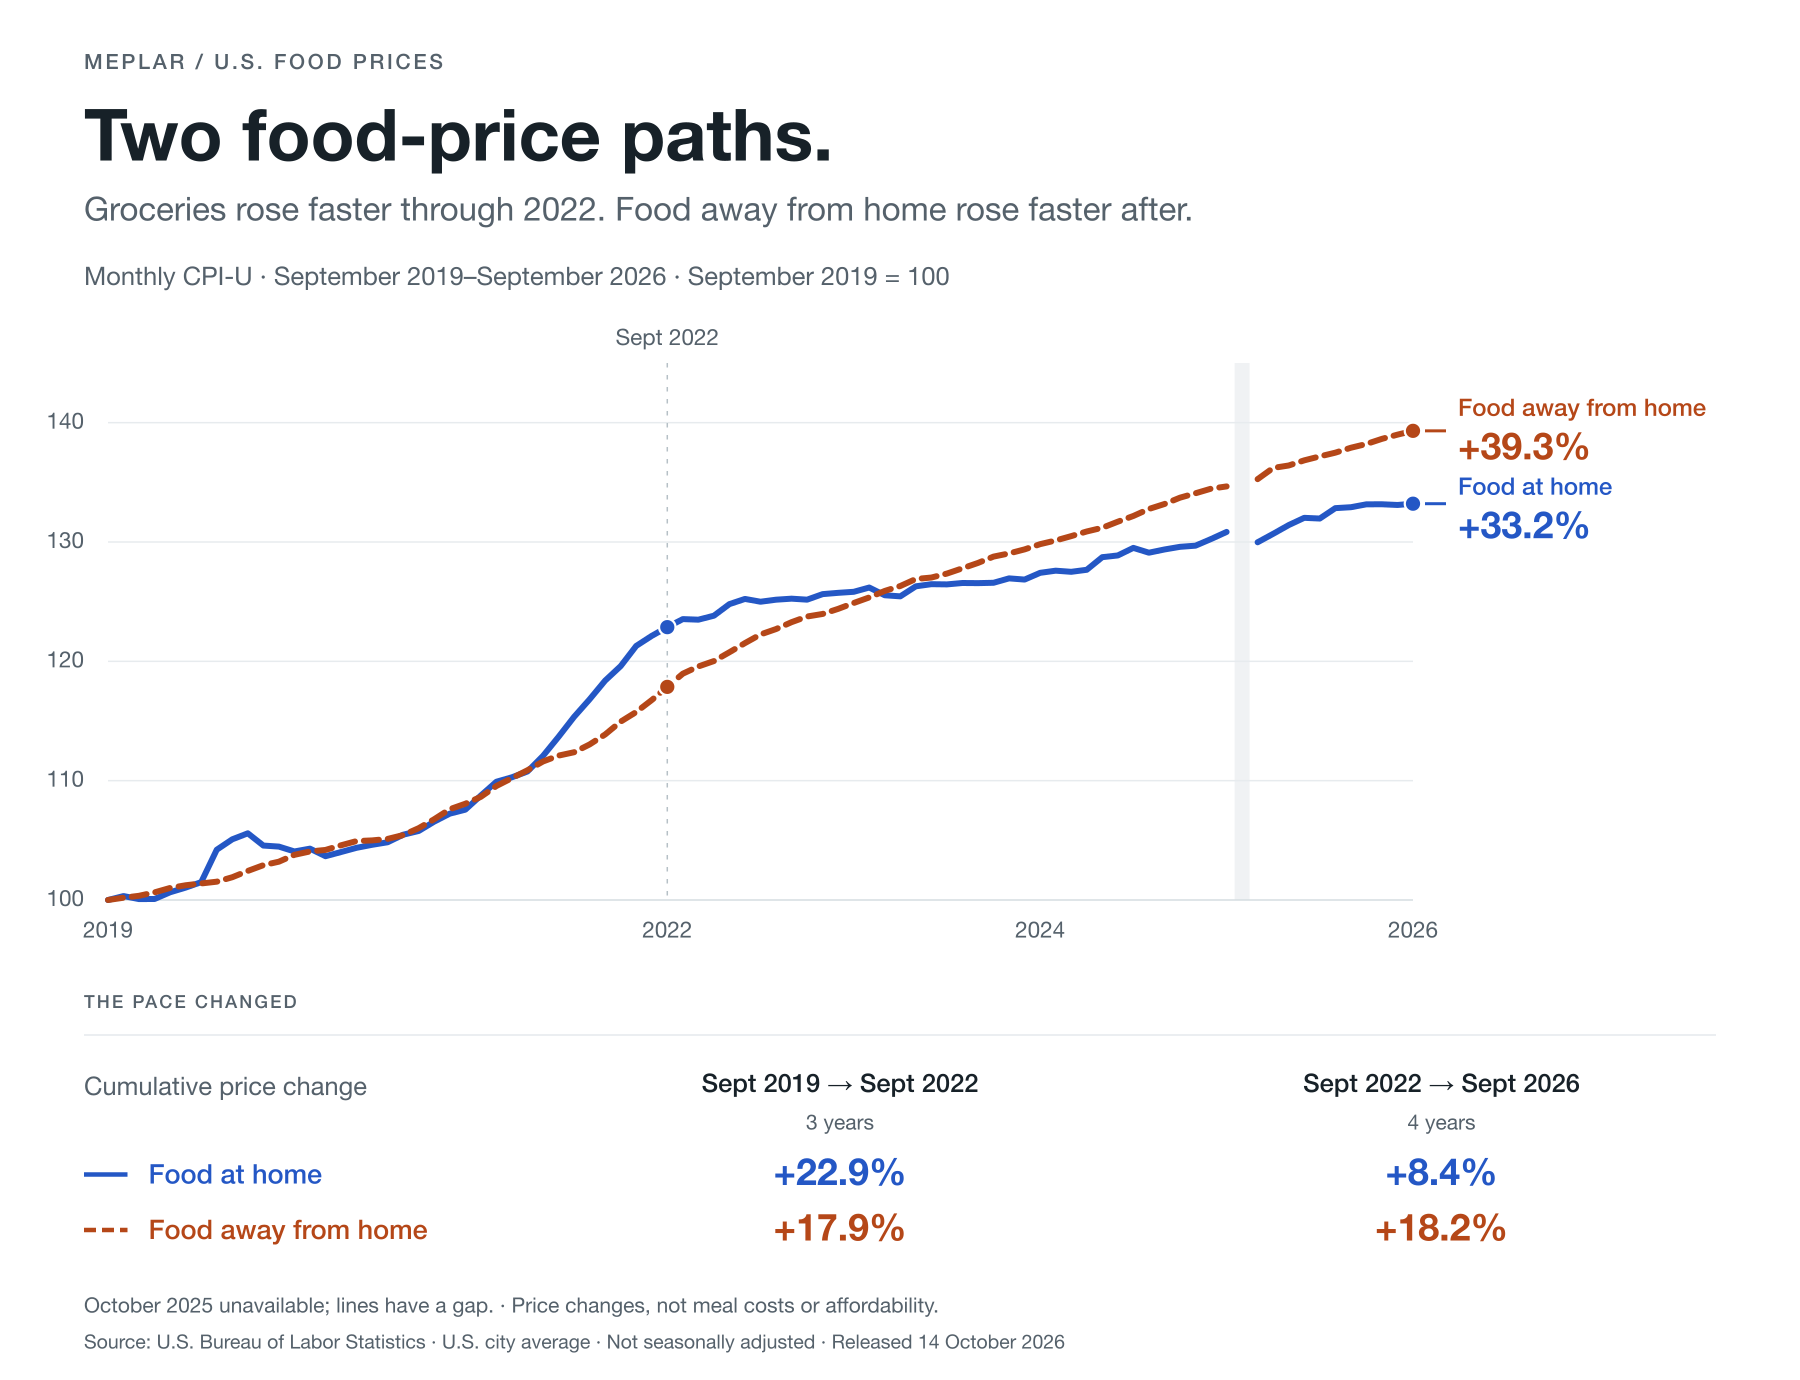
The lead switched. From September 2019 to September 2022, grocery prices rose more. Over the next four years, food away from home rose 18.2%, compared with 8.4% for food at home.

September 2019–September 2026 · Monthly, not seasonally adjusted · BLS release: 14 October 2026

Two monthly food-price paths, September 2019 equals 100. Food at home rose 33.2 percent and food away from home 39.3 percent by September 2026. The relative pace reversed after September 2022. Both lines have an October 2025 gap.
Same starting point; different price changes. The index does not compare the cost of an equivalent meal. Open full-size chart

The second stretch reversed the first.

In the three years to September 2022, the food-at-home index rose 22.9%, ahead of the 17.9% increase for food away from home. In the four years that followed, the ordering reversed: 8.4% at home and 18.2% away.

By September 2026, prices were 33.2% above the starting point at home and 39.3% above it away from home. Slower growth in grocery prices still meant a higher price level.

What “away from home” covers

The BLS category includes restaurants, takeout, meals at schools and workplaces, vending, mobile vendors and catering. It is broader than restaurants. These national averages do not describe every city, household or food purchase.
Source & method

Source: U.S. Bureau of Labor Statistics, CPI-U food series. U.S. city average, all urban consumers, monthly, not seasonally adjusted. The September 2026 release was published on 14 October 2026; files were retrieved directly on 18 October 2026.

Food at home: CUUR0000SAF11. Food away from home: CUUR0000SEFV. Both source series use 1982–84 = 100. We rebase each separately: 100 × CPI(month) / CPI(September 2019). Period change is 100 × (CPI(end) / CPI(start) − 1), calculated from unrounded source values and displayed to one decimal. Annual-average M13 rows are excluded.

Series definitions · BLS release · CPI concepts · Metadata & source hashes

Missing month & interpretation

October 2025 is unavailable in both series. BLS marks it X because of the 2025 lapse in appropriations. We retain an empty month and break both lines; no interpolation or carry-forward is used. See the BLS footnote codes.

These indexes measure price changes, not dollar meal costs, spending, wages or affordability. A shared value of 100 is a chart baseline, not an assertion that the two food baskets cost the same. The series are not seasonally adjusted, so monthly wiggles can include seasonal effects; the highlighted comparisons use September endpoints. This chart does not establish the causes of the changes.

Data access & reuse

The 85-month CSV contains original and rebased levels, with empty October 2025 values. The 170-row source extract preserves the original missing-value marker and footnote. Period calculations are also available.

BLS government data are public domain under the agency’s reuse policy. Cite BLS as the data source and Meplar as the chart author. No BLS emblem is used. The fixed-version download package includes frozen source files, checksums and a CSV reproduction script.

Take a closer look.

Original vector chart, high-resolution image and monthly data.

Chart