What the chart shows
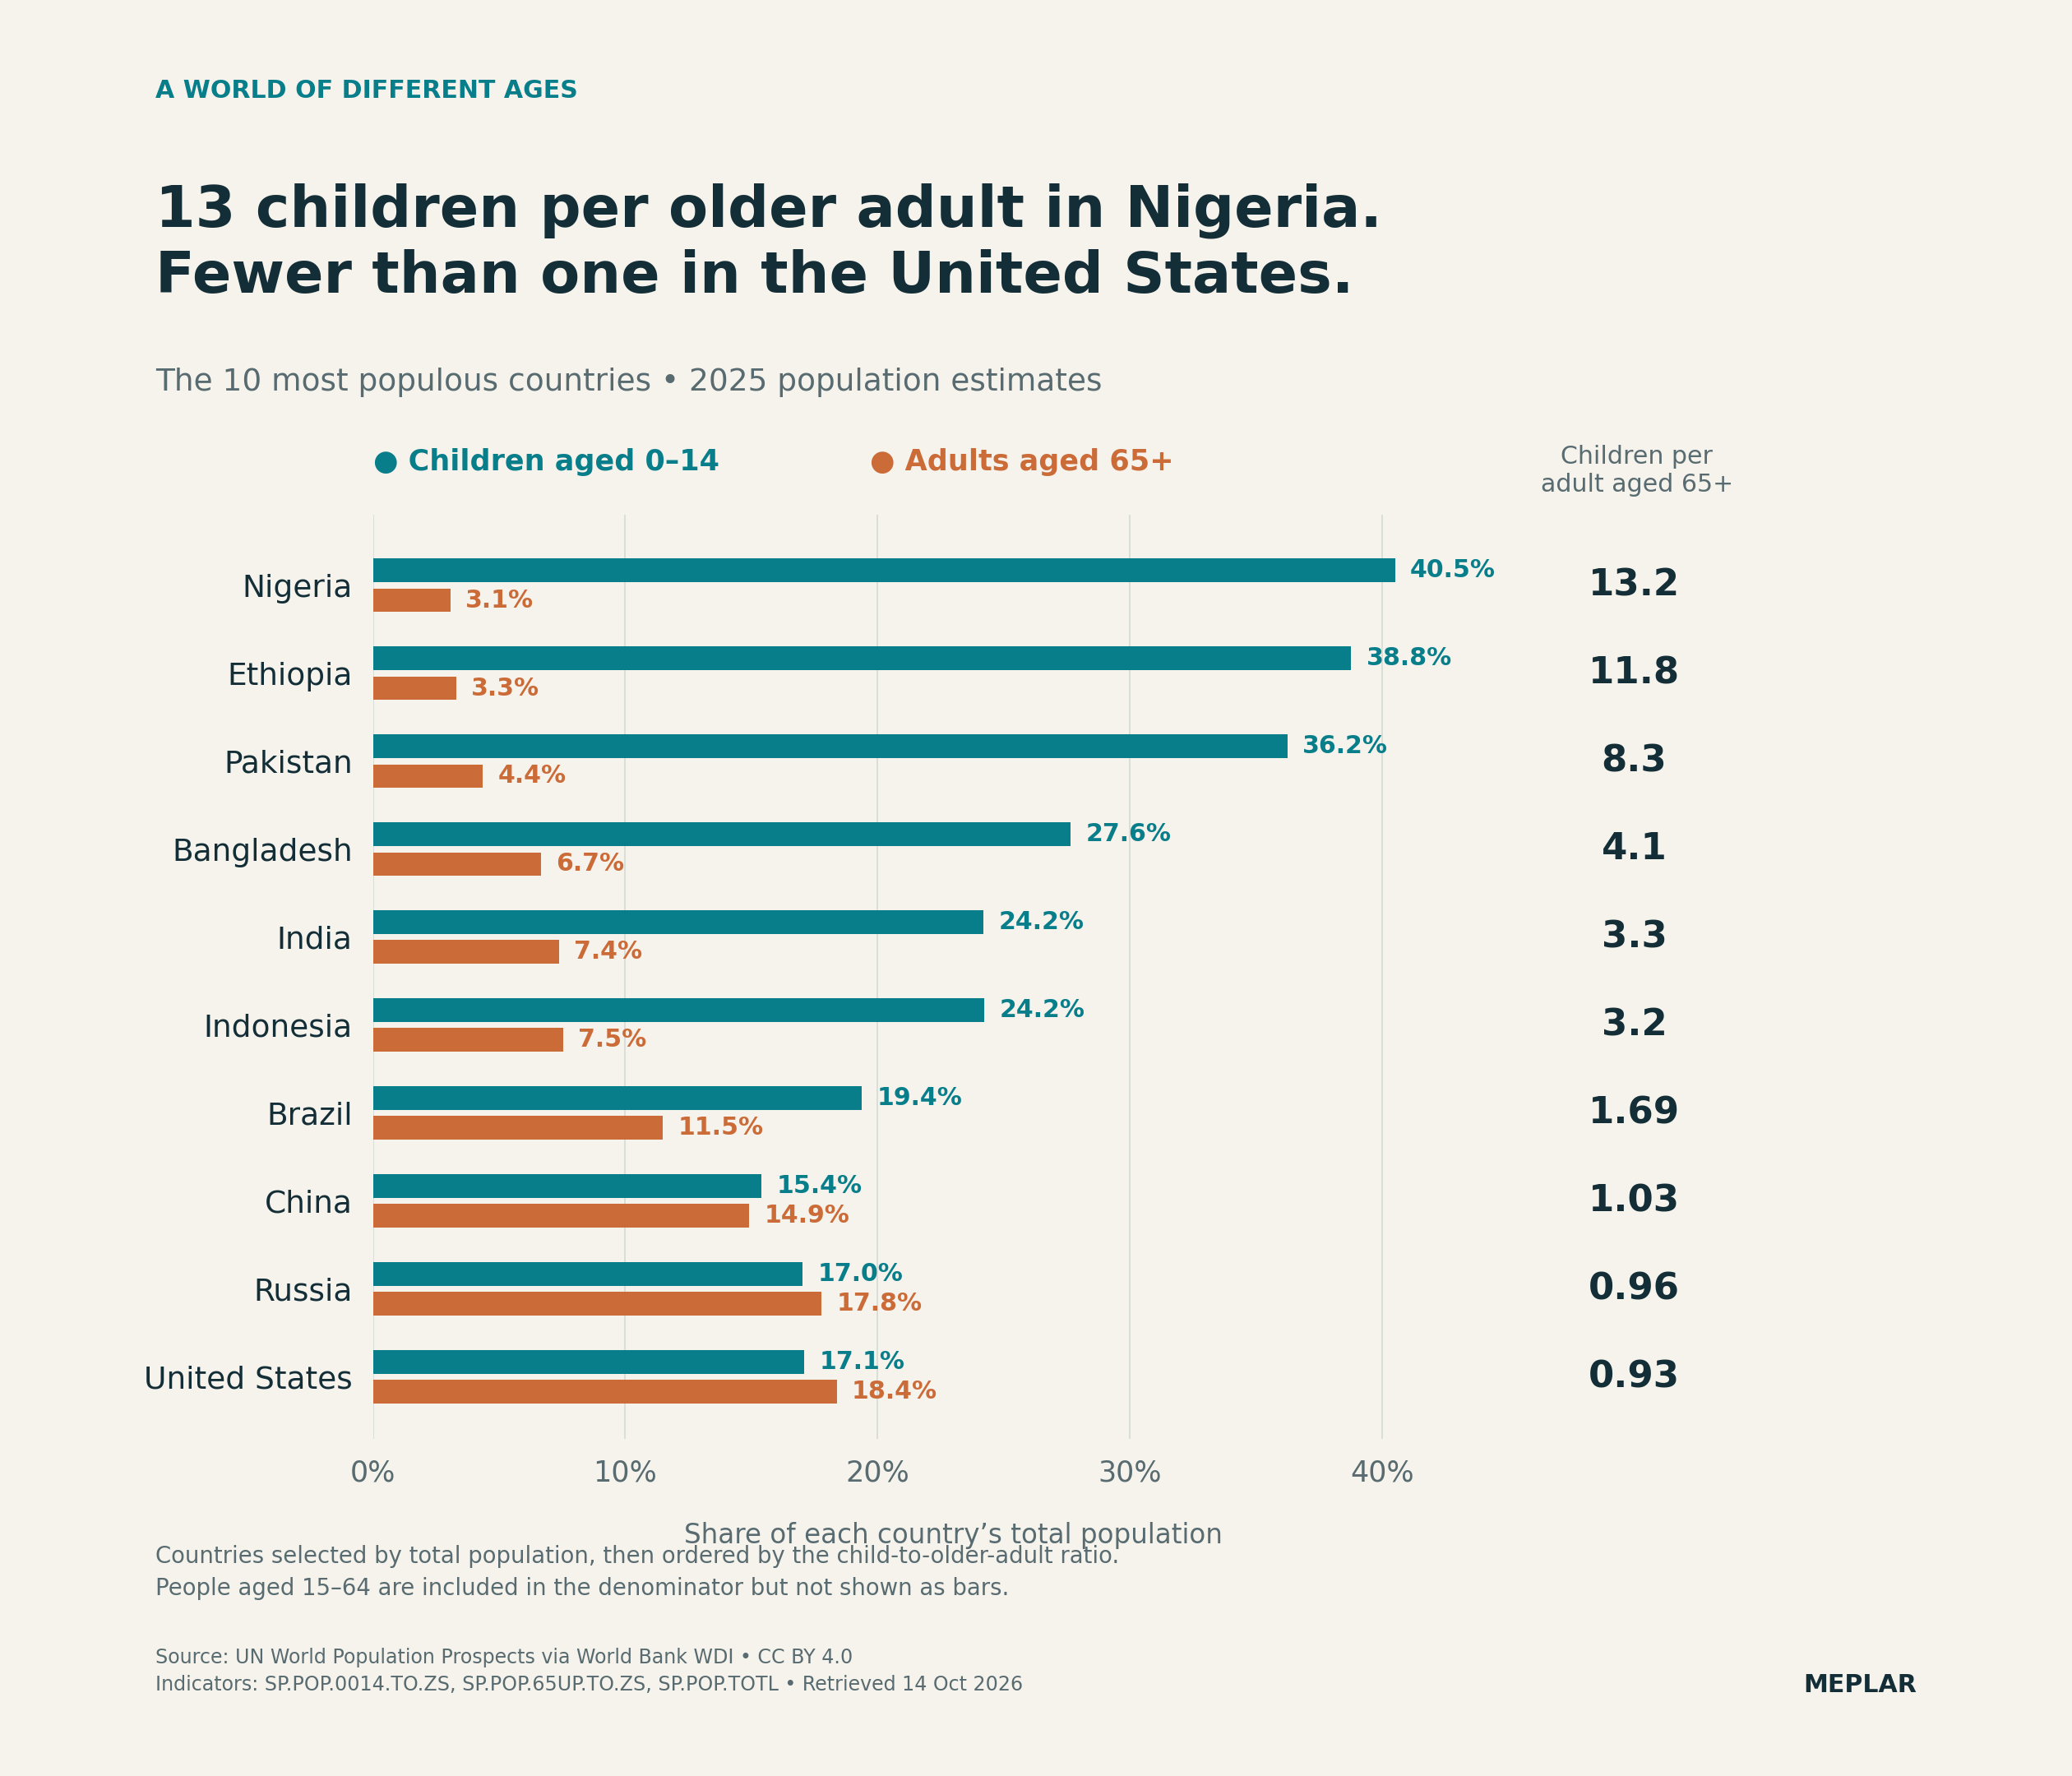
Among the ten most populous countries in the 2025 estimates, Nigeria has 13.2 children aged 0–14 per adult aged 65+, while the United States has 0.93.
Both shares use the total population as denominator, including people aged 15–64. Dividing the unrounded child share by the older-adult share gives an age-group ratio. It does not describe family size or children per parent.
World Bank countries/economies and overlapping aggregate groups, 1960–2025; chart selects the ten most populous non-aggregate economies in 2025.
How it was made
Decode frozen WDI source-2 API JSON, map source entity IDs through official country metadata, outer-join by entity and year and retain nulls as blank CSV fields. Select the ten non-aggregate economies with greatest 2025 population, then order by children_pct divided by older_pct. Working-age share is 100 minus both age shares, for ages 15–64.
Definitions & limits
- Age structure comes from UN World Population Prospects via WDI. These are modeled or interpolated population estimates, not a finalized 2025 census, and establish no causal or policy conclusion.
- Both age shares use total population as their denominator; the displayed ratio uses unrounded shares and can differ from ratios of rounded labels. Working-age share is an age band, not employment status.
- All ten selected economies have both age shares; none is discarded. Source country/economy rows can include territories. World Bank three-character identifiers are not invariably ISO codes.
- Aggregate rows overlap and must not be summed. All 17,556 entity-year rows for 1960–2025 remain in the full CSV, including missing indicators; blanks are never zero-filled.
- The snapshot was retrieved on 14 October 2026, with WDI last updated on 8 October 2026. No interpolation, smoothing, imputation, winsorization or manual numerical edits were applied by Meplar.
- Source data are CC BY 4.0 with World Bank additional terms. Attribute the sources, link the license and identify the described transformations. No World Bank or UN endorsement is implied.
Original sources
Snapshot date: 2026-10-14. Source releases and observations can be revised; the linked download notes describe this fixed version.