What the chart shows
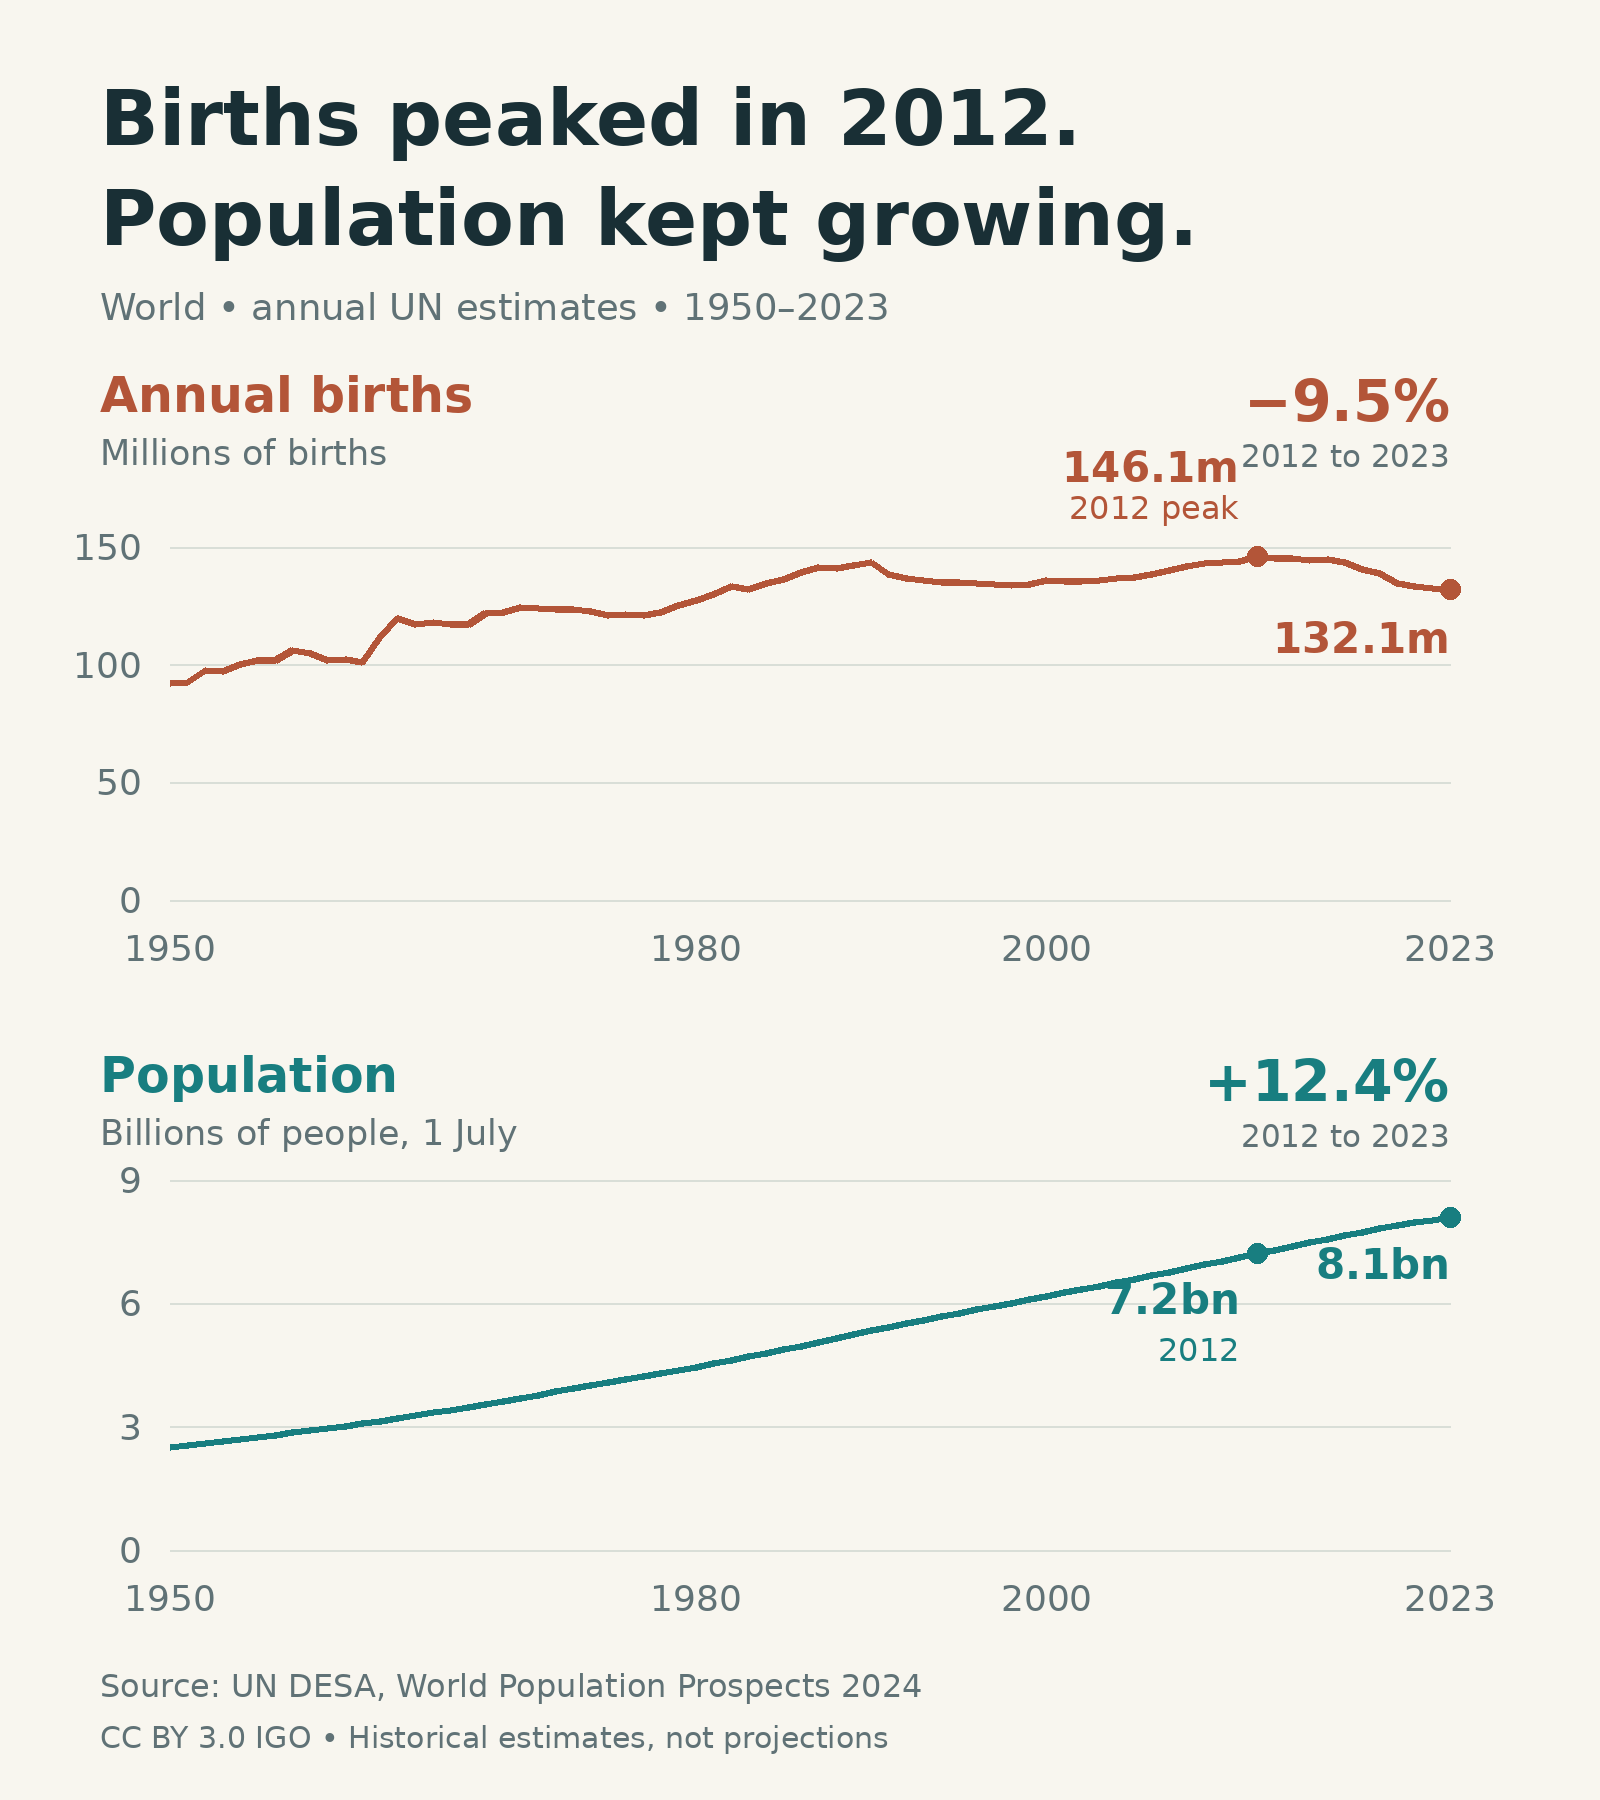
In the UN's 1950–2023 estimates, annual world births peaked at 146.1 million in 2012. By 2023, births were 9.5% lower while population was 12.4% higher.
World annual historical estimates, 1950–2023. Births during the year and population on 1 July.
How it was made
Use the UN World Population Prospects 2024 historical World series, 1950–2023. Convert thousands to people, then calculate changes from the maximum included birth year to 2023. Plot births and population in separate, zero-based panels.
Definitions & limits
- These are modeled historical estimates, not exact census counts or projections.
- The peak refers to the included 1950–2023 series; the chart makes no claim about years after 2023.
- World and country tables are separate. Do not add the World series to country totals.
Original sources
Snapshot date: 2026-10-13. Source releases and observations can be revised; the linked download notes describe this fixed version.