What the chart shows
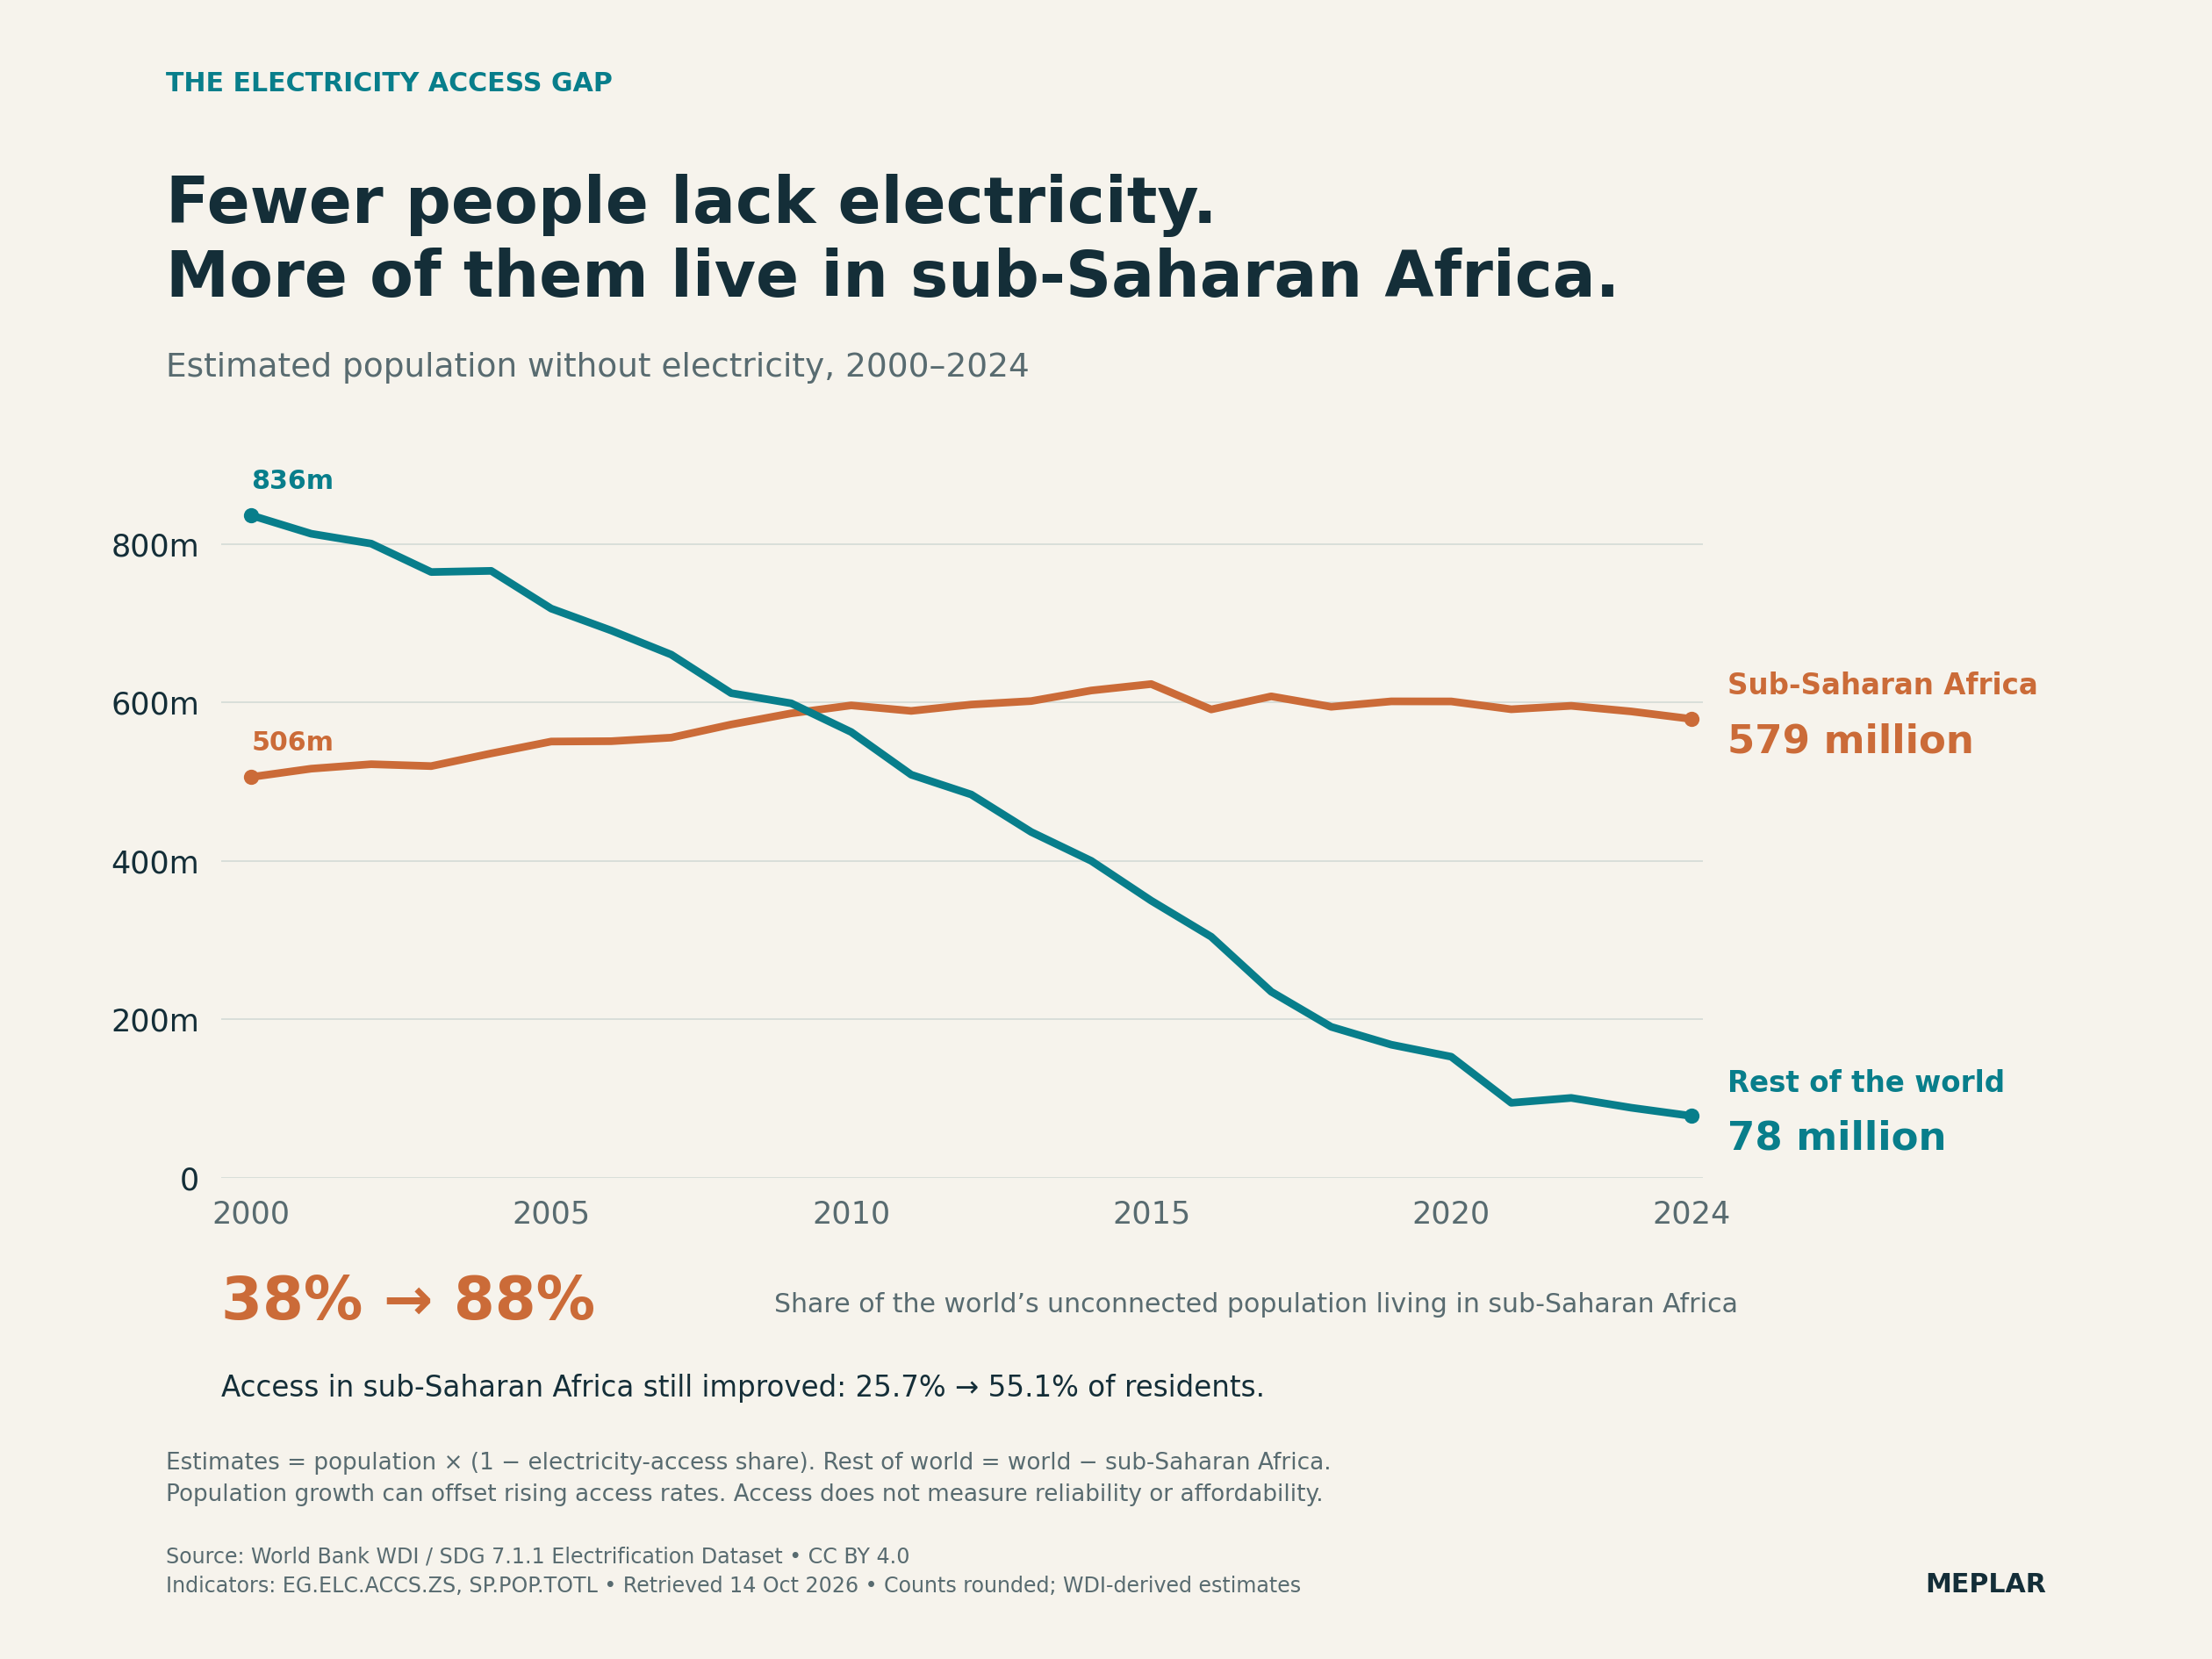
WDI-derived estimates put the global population without electricity at 1.34 billion in 2000 and 657 million in 2024. Sub-Saharan Africa’s share of that estimated gap rose from 37.7% to 88.1%.
The reconstructed count in sub-Saharan Africa rose from about 506 million to 579 million even while its access rate improved from 25.7% to 55.1%. The rest-of-world estimate fell from about 836 million to 78 million. Population growth is mathematically relevant, but these comparisons do not isolate causes.
World Bank countries/economies and aggregates, 1960–2025; access observations 1990–2024; chart uses World and Sub-Saharan Africa aggregates for every year 2000–2024.
How it was made
Use WDI World (WLD) and Sub-Saharan Africa (SSF, all income levels) aggregates. Estimate population without access as population × (1 − access_pct/100), then subtract SSA from World for the rest of the world. Use all 25 complete shared annual observations from 2000 through 2024, with no smoothing or summing overlapping aggregates.
Definitions & limits
- These are approximate WDI-derived counts reconstructed from separately maintained population and access series, not official published SDG7 headcounts. Access coverage and population vintages can differ, so reconstruction can differ from SDG7 report totals.
- Source access estimates can be survey-based or modeled. No uncertainty intervals are supplied here; point estimates are not exact counts.
- Electricity access does not measure uninterrupted supply, reliability, affordability, consumption or equal household service. Regional aggregates hide within-region variation.
- Population growth can offset improving access rates mathematically; the chart does not isolate causal drivers. 2000 is an interpretable start-of-century baseline, and 2024 is the latest shared access year.
- The full CSV retains 17,556 entity-year records for 1960–2025, including blanks. Access values are available for 1990–2024; blank 2025 access fields do not mean zero access. Aggregates overlap and must not be summed.
- The 14 October 2026 source-2 WDI snapshot reports an 8 October 2026 update. Data are CC BY 4.0 with World Bank additional terms; preserve attribution, changes and licensing links, with no endorsement implied.
Original sources
Snapshot date: 2026-10-14. Source releases and observations can be revised; the linked download notes describe this fixed version.