What the chart shows
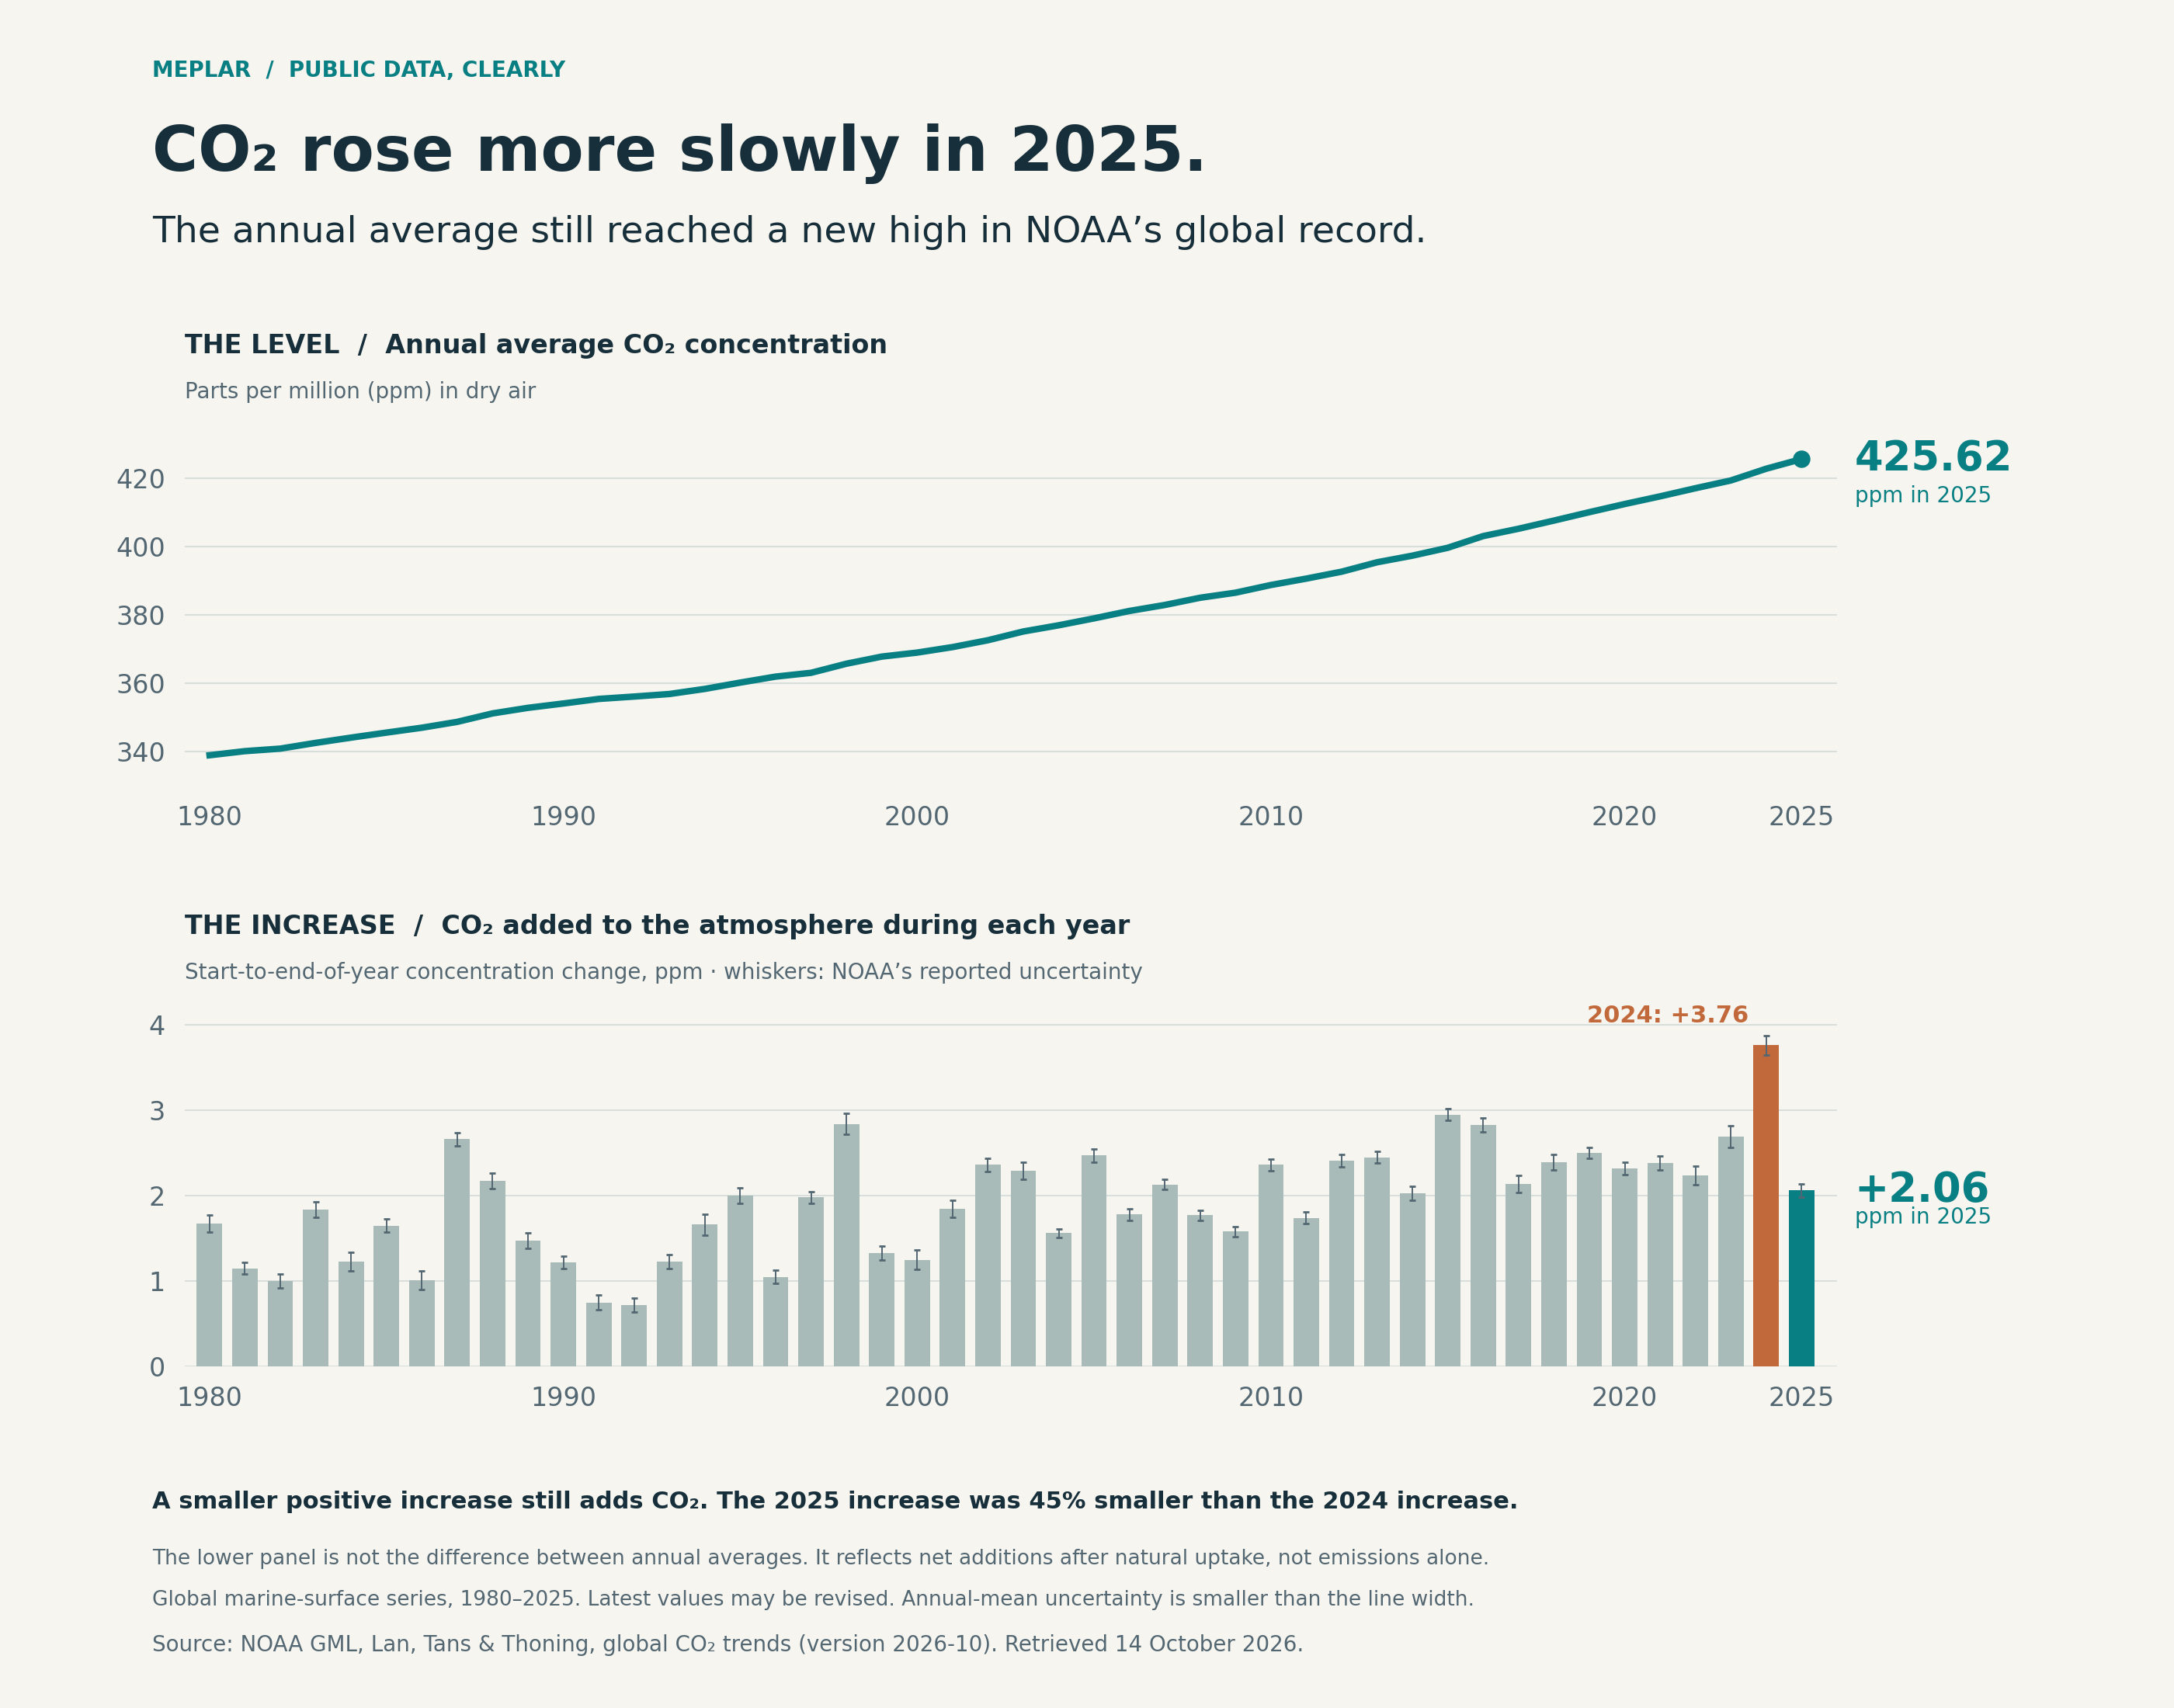
NOAA’s estimated within-year CO₂ increase slowed from 3.76 ppm in 2024 to 2.06 ppm in 2025. The 2025 annual mean still reached 425.62 ppm.
The within-year increase was 45.2% smaller in 2025, but it remained positive. The annual mean was the highest in this available 1979–2025 global marine-surface mean series. This is a statement about the instrumental dataset, not a geological record.
Global marine-surface measurements; chart 1980–2025; growth series 1959–2025 and annual means 1979–2025.
How it was made
Retain NOAA’s distinct annual-mean and within-year-growth metrics. Ignore raw CSV comment lines, rename fields and outer-join one row per year. Keep all 67 growth years with blank means before 1979; chart all 46 years 1980–2025. No interpolation, smoothing or outlier removal is used.
Definitions & limits
- Within-year increase is an estimated start-to-end-of-year concentration change in ppm; it is not a percentage, emission mass, or the difference between consecutive annual means. The 2025 difference between annual means is 2.83 ppm and is not substituted for the 2.06 ppm growth estimate.
- NOAA reports growth uncertainty as a 68% interval; plotted whiskers are the value plus or minus that reported uncertainty. Growth is 3.76 ± 0.11 ppm in 2024 and 2.06 ± 0.08 ppm in 2025.
- The 2025 annual mean is 425.62 ± 0.05 ppm. Annual-mean uncertainty is network-derived and narrower than the desktop line width; the mobile chart shows growth whiskers and accompanies these full notes.
- NOAA’s webpage and CSV describe different bootstrap ensemble sizes. Supplied uncertainties are preserved rather than recomputed, and no formal significance test is claimed.
- Growth reflects net human and natural additions and removals, not fossil emissions alone. Earlier growth uses a Mauna Loa/South Pole approximation; 1980 starts the modern global-network growth series. Partial 2026 is excluded and source values may be revised.
- Citation: Lan, X., Tans, P. and K.W. Thoning, Trends in globally-averaged CO₂ determined from NOAA Global Monitoring Laboratory measurements, version 2026-10, doi:10.15138/9N0H-ZH07. Retrieved 14 October 2026.
Original sources
- NOAA GML global CO₂ trends and citation
- NOAA within-year growth method
- NOAA annual-mean CSV
- NOAA growth CSV
- Dataset DOI
Snapshot date: 2026-10-14. Source releases and observations can be revised; the linked download notes describe this fixed version.