Travel
Nine major international airports still below 2019 in 2025
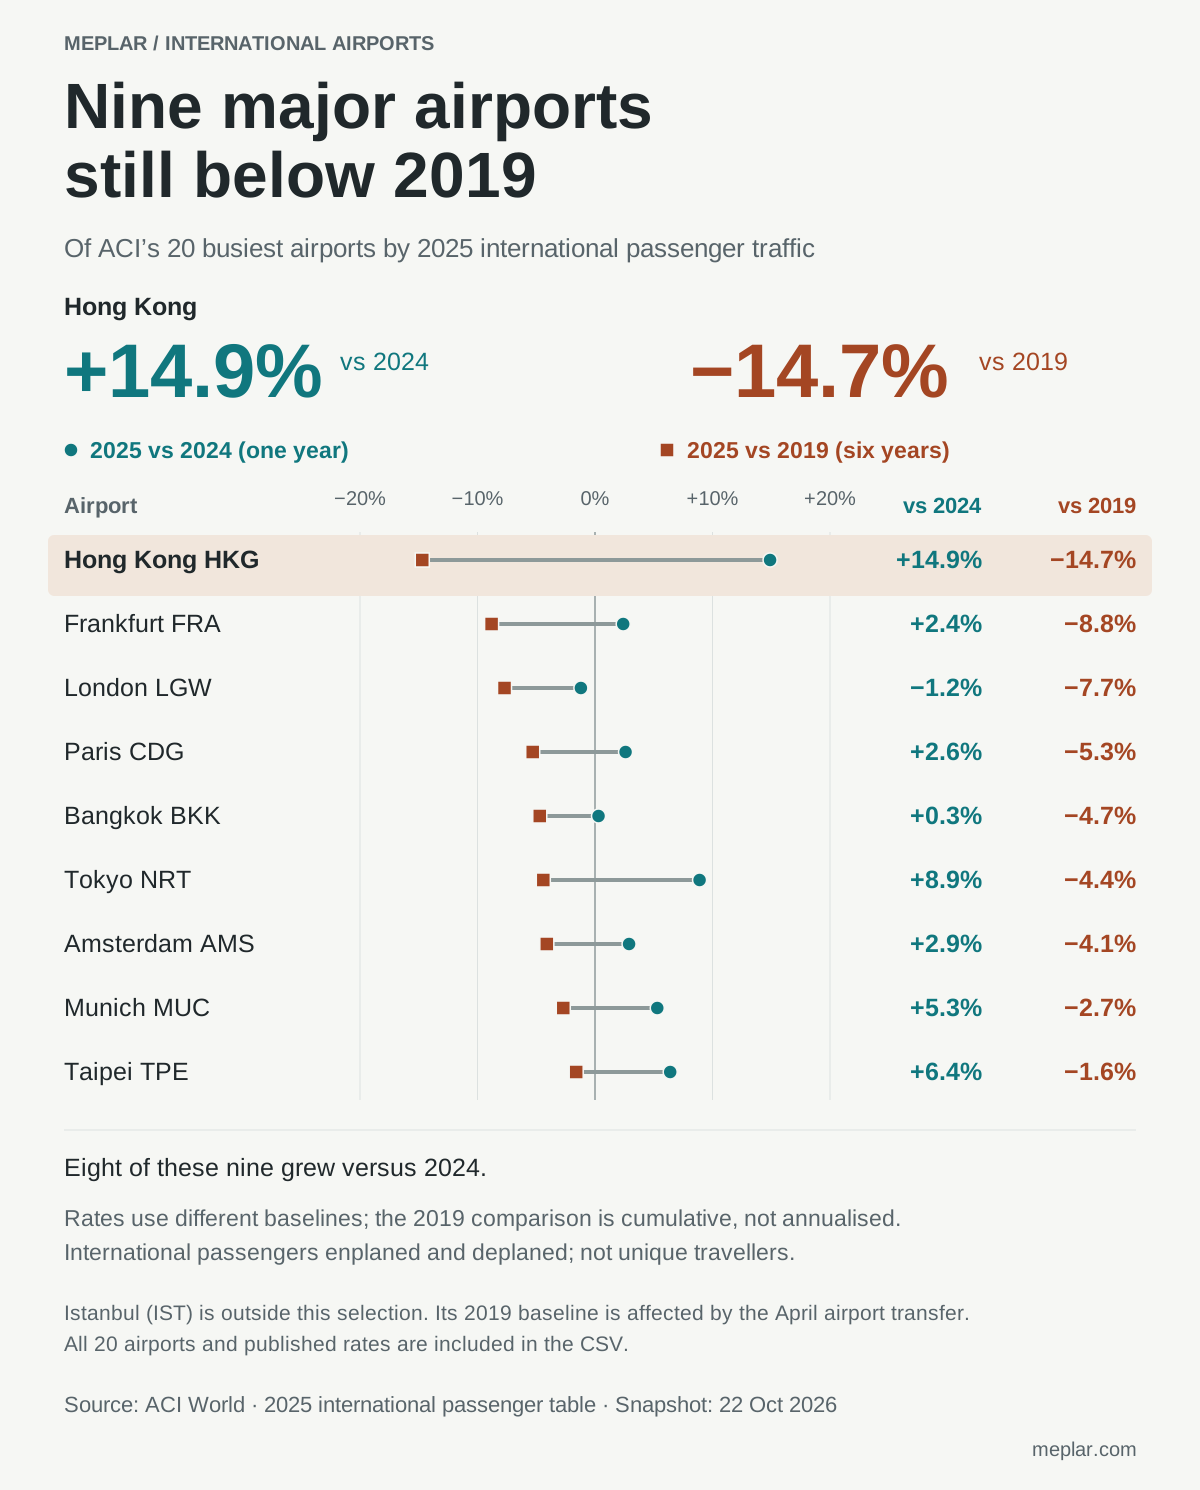
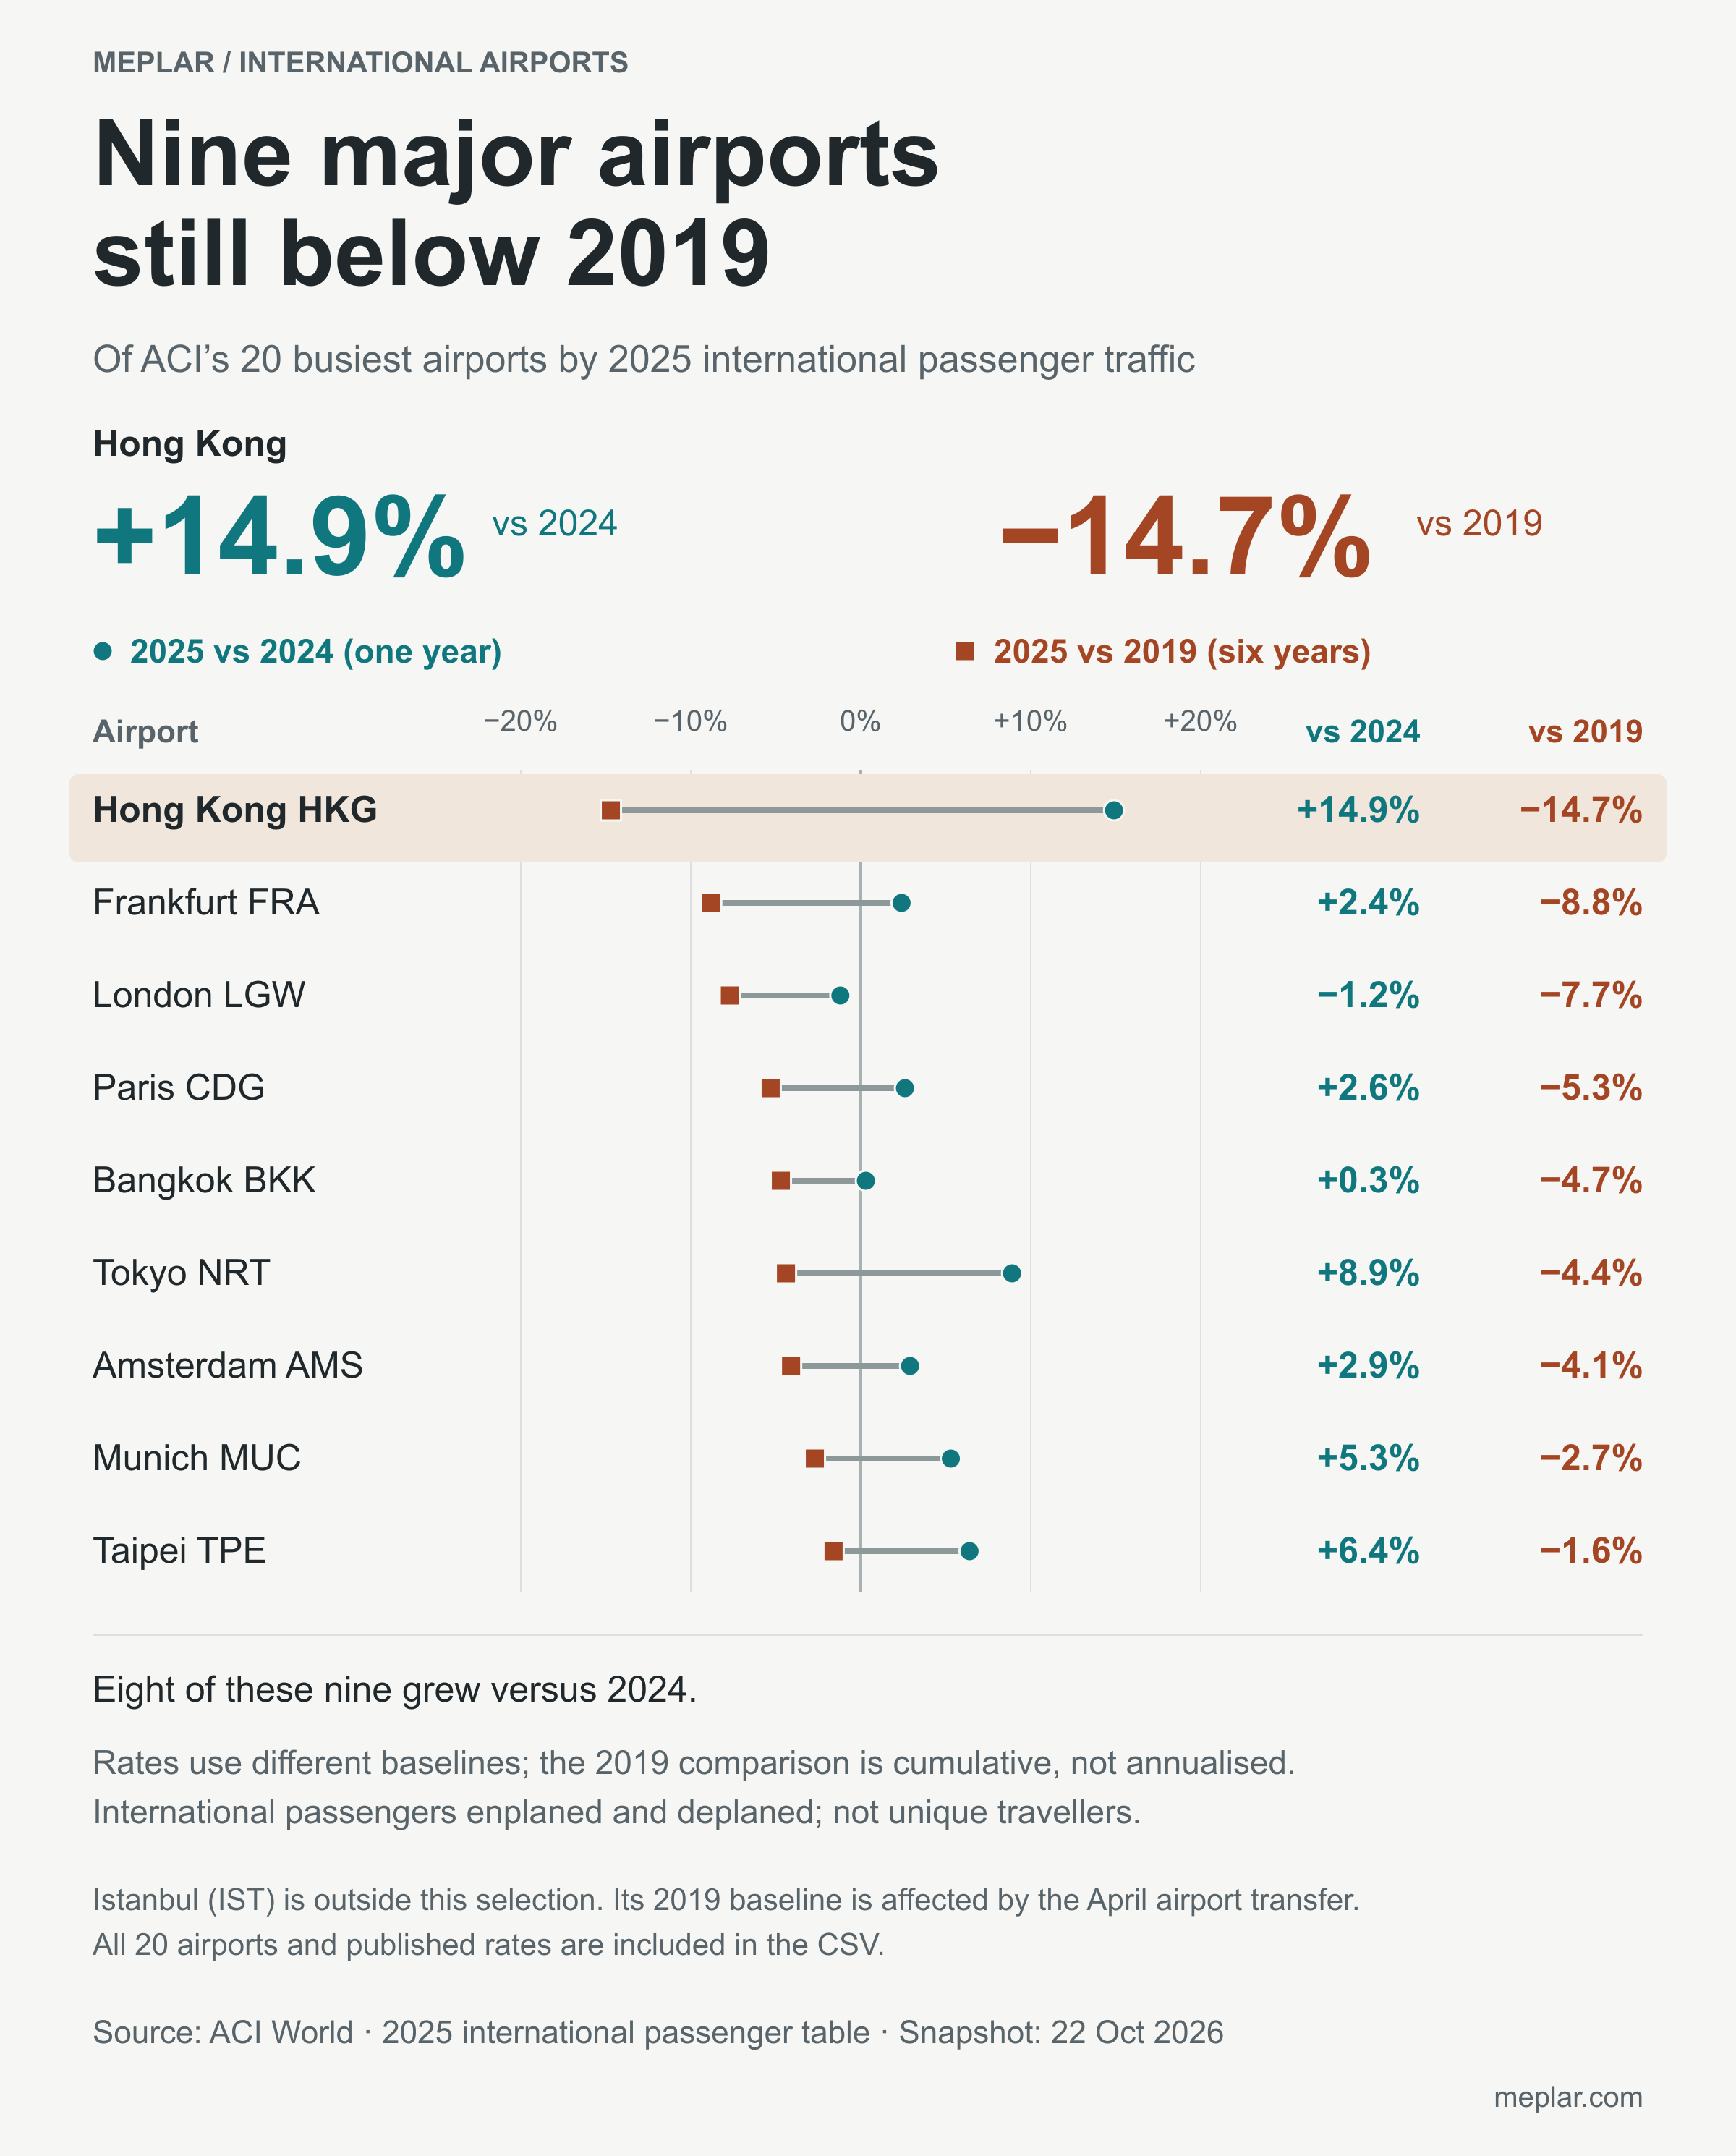
Nine of ACI’s 20 busiest international airports in 2025 remained below their 2019 passenger counts. Eight of those nine grew versus 2024. Hong Kong was up 14.9% in a year but still 14.7% below 2019.
Growth and recovery are different comparisons.
The displayed subset contains exactly the nine airports with negative published 2025-versus-2019 change. Both rate series share a −20% to +20% scale. The 2019 comparison is cumulative, not annualised. All 20 source rows are in the CSV.
IST is outside the displayed subset. Its +68.3% published change versus 2019 is retained in the full CSV with the April 2019 Atatürk-to-Istanbul Airport transition caveat; no like-for-like long-term growth claim is made. No universal causal explanation is asserted.
The displayed subset
| Airport | vs 2024 | vs 2019 |
|---|---|---|
| Hong Kong HKG | 14.9% | -14.7% |
| Frankfurt FRA | 2.4% | -8.8% |
| London LGW | -1.2% | -7.7% |
| Paris CDG | 2.6% | -5.3% |
| Bangkok BKK | 0.3% | -4.7% |
| Tokyo NRT | 8.9% | -4.4% |
| Amsterdam AMS | 2.9% | -4.1% |
| Munich MUC | 5.3% | -2.7% |
| Taipei TPE | 6.4% | -1.6% |
Source, method & limits
ACI’s current 20 busiest airports by 2025 international passenger traffic form the source cohort, not all world airports or the 2019 top 20. Exactly nine have negative published change versus 2019; all 20 rows remain in the CSV.
International passengers are enplaned and deplaned passenger movements, not unique travellers. One series compares 2025 with 2024; the other compares 2025 with 2019, a cumulative six-year change rather than an annualised rate. Both series use the same −20% to +20% scale.
Eight of the nine displayed airports grew versus 2024; London LGW did not. Hong Kong HKG is +14.9% versus 2024 and −14.7% versus 2019. These statements use published one-decimal rates, without reconstructing exact prior-year counts.
The source percentages were parsed from captured original public HTML, specifically the international passenger table and its enplaned/deplaned footnote. Capture: 22 October 2026; page modification: 15 October 2026. This is not claimed to be a frozen September snapshot.
IST is outside the displayed subset. Its +68.3% published change versus 2019 is retained in the full CSV with the April 2019 Atatürk-to-Istanbul Airport transition caveat; no like-for-like long-term growth claim is made. No universal causal explanation is asserted.
Source capture & reproduction
Source percentages parsed from captured original public HTML. IST is outside the displayed negative-change subset; its April 2019 transition and comparability limitation are recorded in metadata and the full 20-row CSV.