South Korea / Population
Birth rates switched places: South Korea’s age-group reversal.
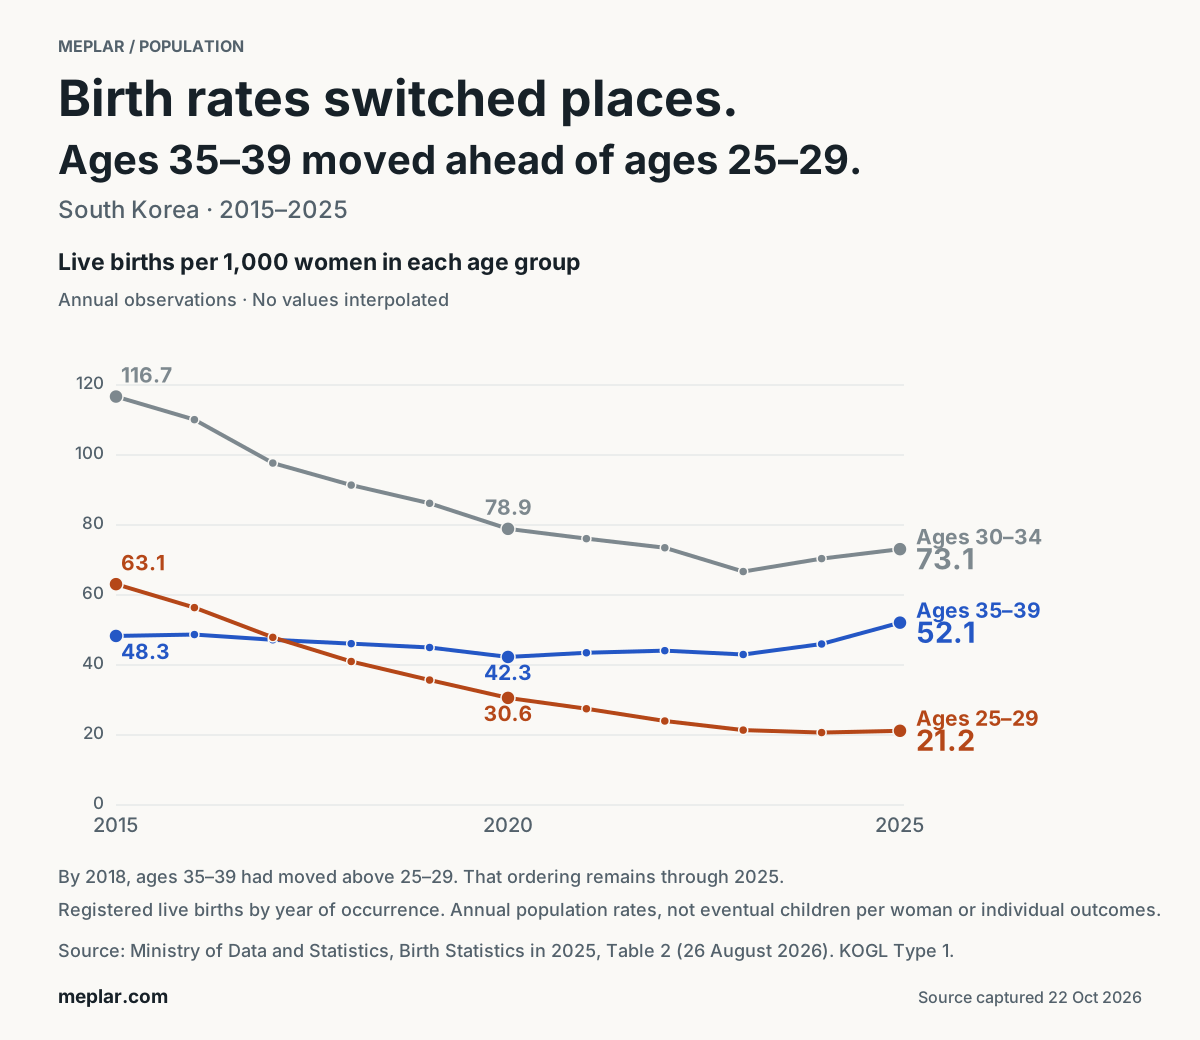
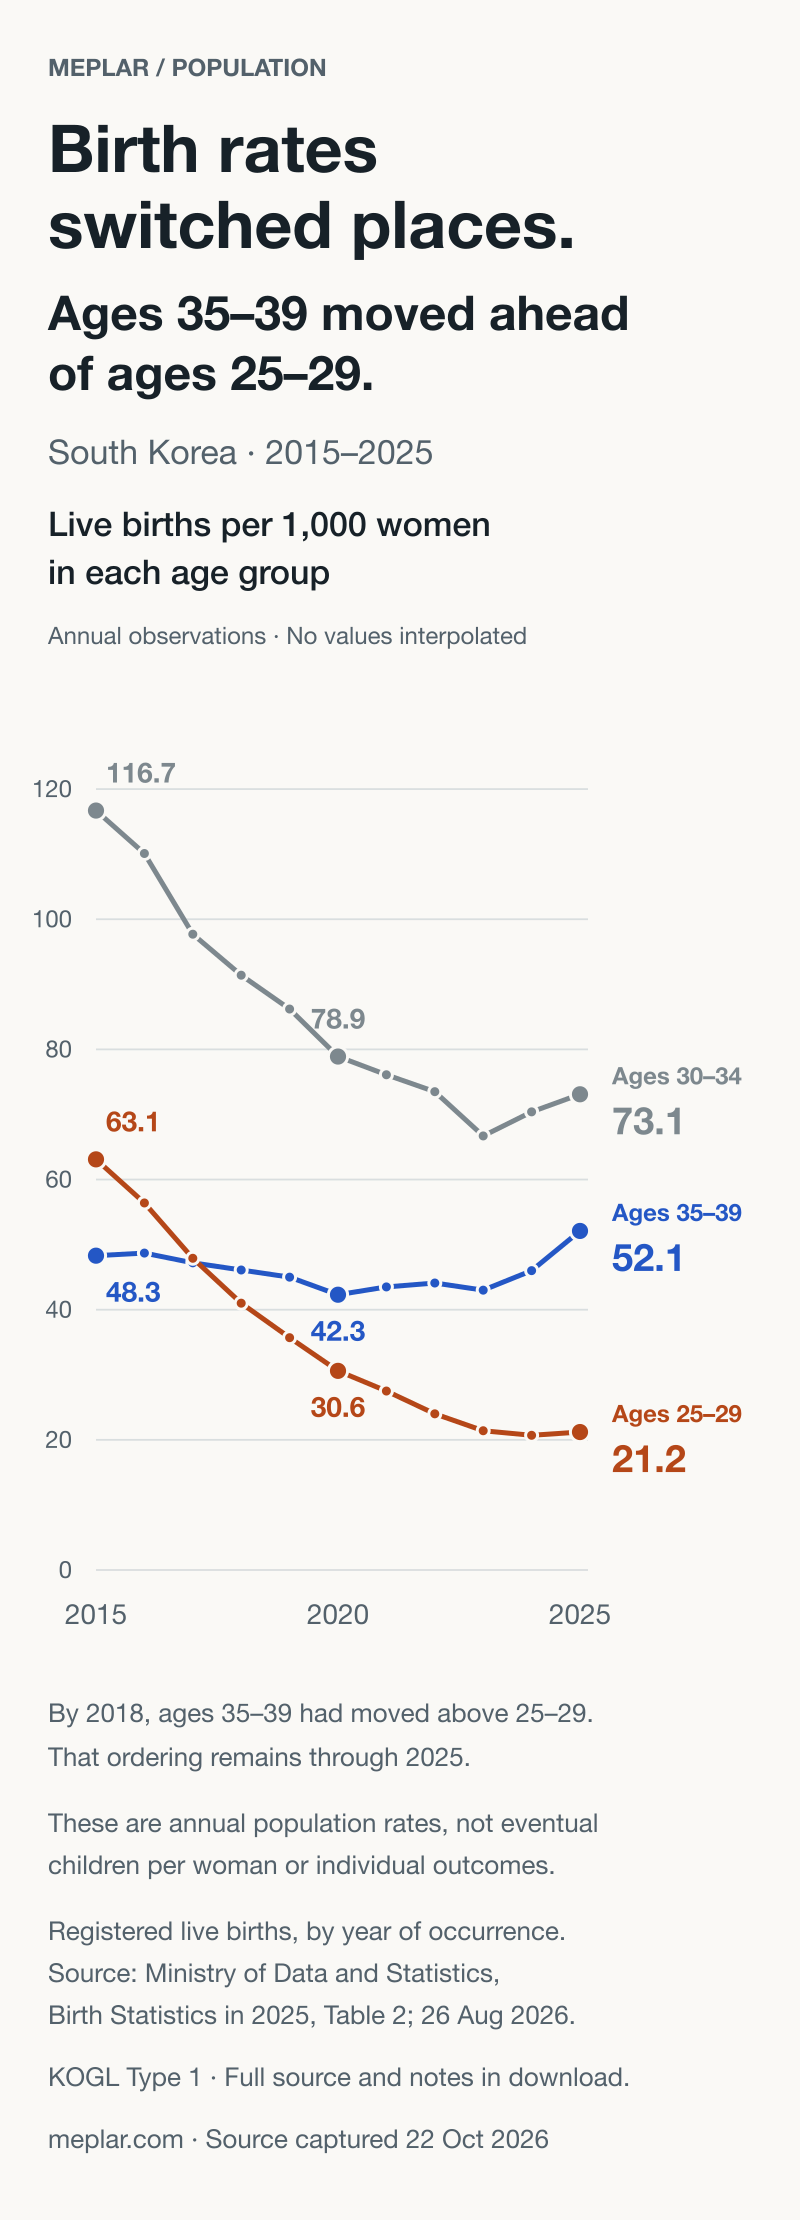
From 2015 to 2025, annual live births per 1,000 women fell from 63.1 to 21.2 at ages 25–29, while the rate at ages 35–39 moved from 48.3 to 52.1. The latter group first moved above the younger group in the 2018 annual figures within this window.
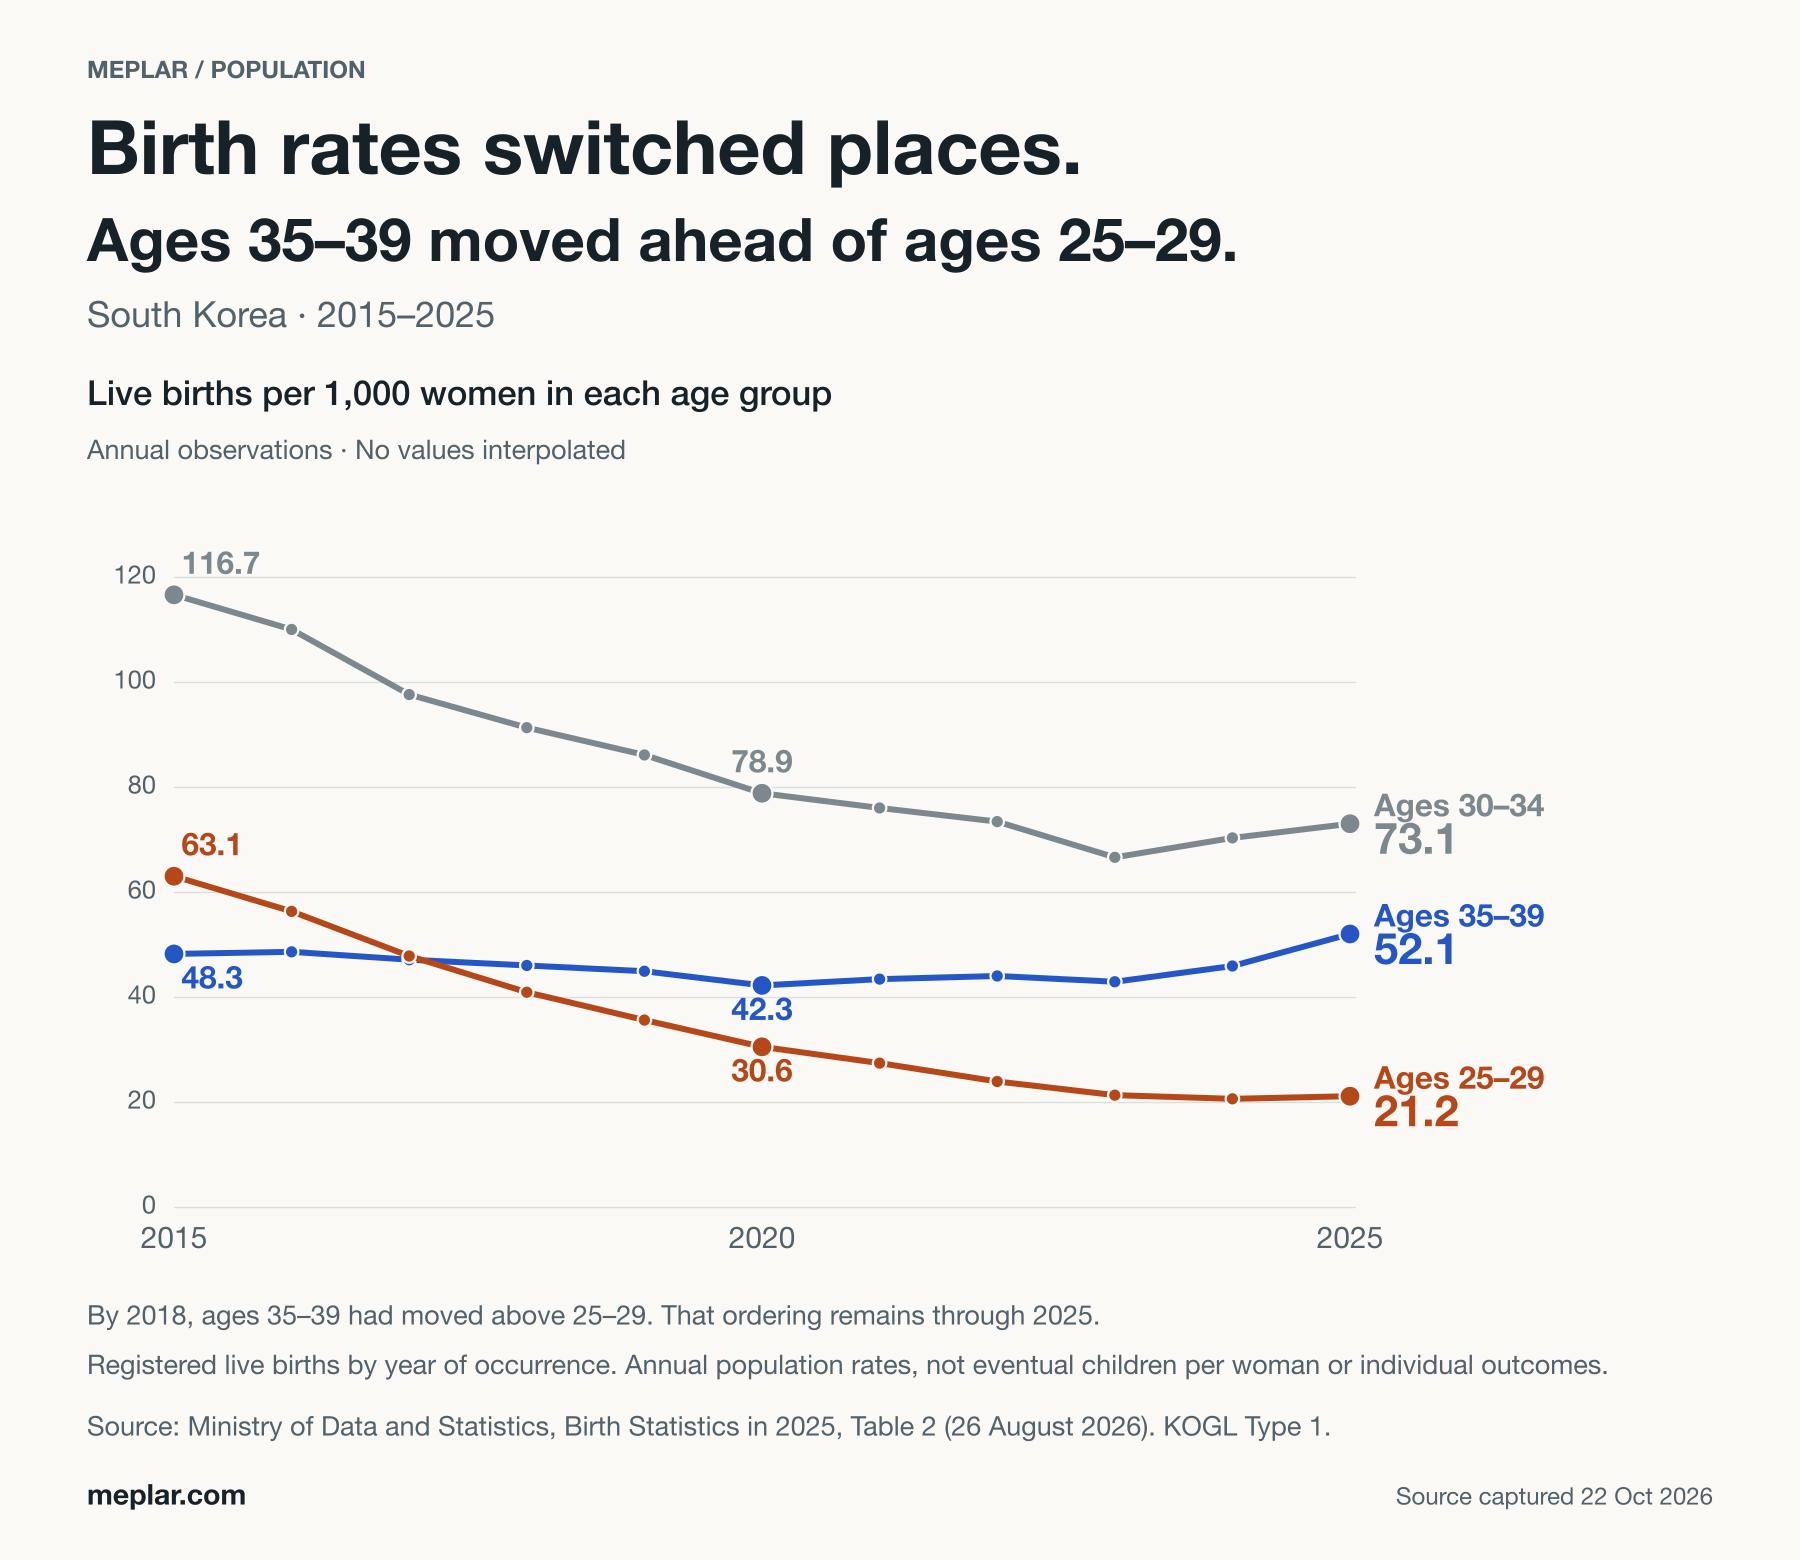
The ordering changed.
In 2015, the age-specific rate at ages 25–29 was higher than at ages 35–39: 63.1 versus 48.3 births per 1,000 women in the respective age groups. In 2025, those rates were 21.2 and 52.1.
The first annual observation with ages 35–39 higher in this window is 2018: 46.1 versus 41.0. Ages 30–34 provide context, falling from 116.7 in 2015 to 73.1 in 2025, with increases in the last two years.
These are annual registered-birth population rates. They do not measure eventual children per woman or track the same women over time, and do not establish causes or support medical conclusions.
All eleven annual observations
| Year | Ages 25–29 | Ages 30–34 | Ages 35–39 |
|---|---|---|---|
| 2015 | 63.1 | 116.7 | 48.3 |
| 2016 | 56.4 | 110.1 | 48.7 |
| 2017 | 47.9 | 97.7 | 47.2 |
| 2018 | 41.0 | 91.4 | 46.1 |
| 2019 | 35.7 | 86.2 | 45.0 |
| 2020 | 30.6 | 78.9 | 42.3 |
| 2021 | 27.5 | 76.1 | 43.5 |
| 2022 | 24.0 | 73.5 | 44.1 |
| 2023 | 21.4 | 66.7 | 43.0 |
| 2024 | 20.7 | 70.4 | 46.0 |
| 2025 | 21.2 | 73.1 | 52.1 |
Source, scope & uncertainty
Annual live births to mothers in an age group divided by that year’s mid-year female population in the same age group, multiplied by 1,000. The denominator is women in that age group, not all women, total population, births or mothers only.
South Korea/Republic of Korea registration statistics. Source: Ministry of Data and Statistics, Birth Statistics in 2025, released 26 August 2026. The final 2025 results concern births occurring in 2025 reported through April 2026; these differ from the February 2026 preliminary release. Events are grouped by date of occurrence, not date of registration.
Use all 11 annual observations from 2015 through 2025 for ages 25–29,30–34 and 35–39:33 plotted values. Extracted unchanged from the full Korean PDF’s Table 2 (printed page 5/PDF page 10) and independently cross-checked against its historical table (printed page 33/PDF page 38). Nine labelled values for 2015,2020 and 2025 also agree with the English summary figure on PDF page 3.
Ages 25–29:63.1 to 21.2; ages 35–39:48.3 to 52.1; ages 30–34:116.7 to 73.1. The first annual observation with 35–39 above 25–29 in this 2015–2025 window is 2018 (46.1 versus 41.0);2017 was 47.2 versus 47.9. No within-year crossing date is estimated.
These are annual population rates for different age groups, not the eventual number of children a woman will have, the total fertility rate, an individual probability, or a longitudinal comparison of the same women. The chart does not establish causes or support medical conclusions. Ages 30–34 provide context; no claim of an uninterrupted fall or rise is made.
Published rates retain one decimal place. No smoothing, interpolation, reweighting, inferred annual values or age-band splicing. The source-full CSV keeps all 45 annual rows 1981–2025, seven age-specific rates and a separately labelled total-fertility-rate field with a different unit. Only the 33 selected age-specific values are plotted.
Python’s standard library parses a frozen mechanical pdftotext extraction of PDF page 38. Optional --extract-pdf regenerates that extract from the unchanged original Korean PDF using an existing pdftotext installation and requires byte equality. The original PDF hash and exact source pages are retained. All CSVs and SVGs reproduce offline; optional PNG reproduction needs the existing librsvg and same fonts.
The Korean report cover visibly carries KOGL Type 1 (attribution). The official Korean release page says attachment reuse follows the type inside the attachment; the ministry policy permits commercial and adapted use for Type 1 with attribution. Attribution: Ministry of Data and Statistics,2026, Birth Statistics in 2025; Vital Statistics Division; responsible officials 박현정 and 이수복; https://mods.go.kr/. Original chart/selection by Meplar; no ministry endorsement implied. No agency logo or source artwork is reused in the chart.
The public source ZIP contains the marked Korean PDF and its mechanical table extract. The unmarked English summary PDF and captured website HTML remain internal verification records and are not redistributed or assigned the Korean attachment’s licence. No blanket artwork licence is invented.
- Ministry of Data and Statistics, Birth Statistics in 2025, English summary; page 3 and definition pages 5–6
- Ministry of Data and Statistics, full Korean release, Table 2 page 5/PDF 10 and historical table page 33/PDF 38
- Official Korean release page,26 August 2026
- Official English release page
- Ministry copyright policy and KOGL conditions
Reproduction & reuse
The fixed-version source ZIP includes the reviewed artwork, three CSVs, metadata, checksums and an offline reproduction script.