What the chart shows
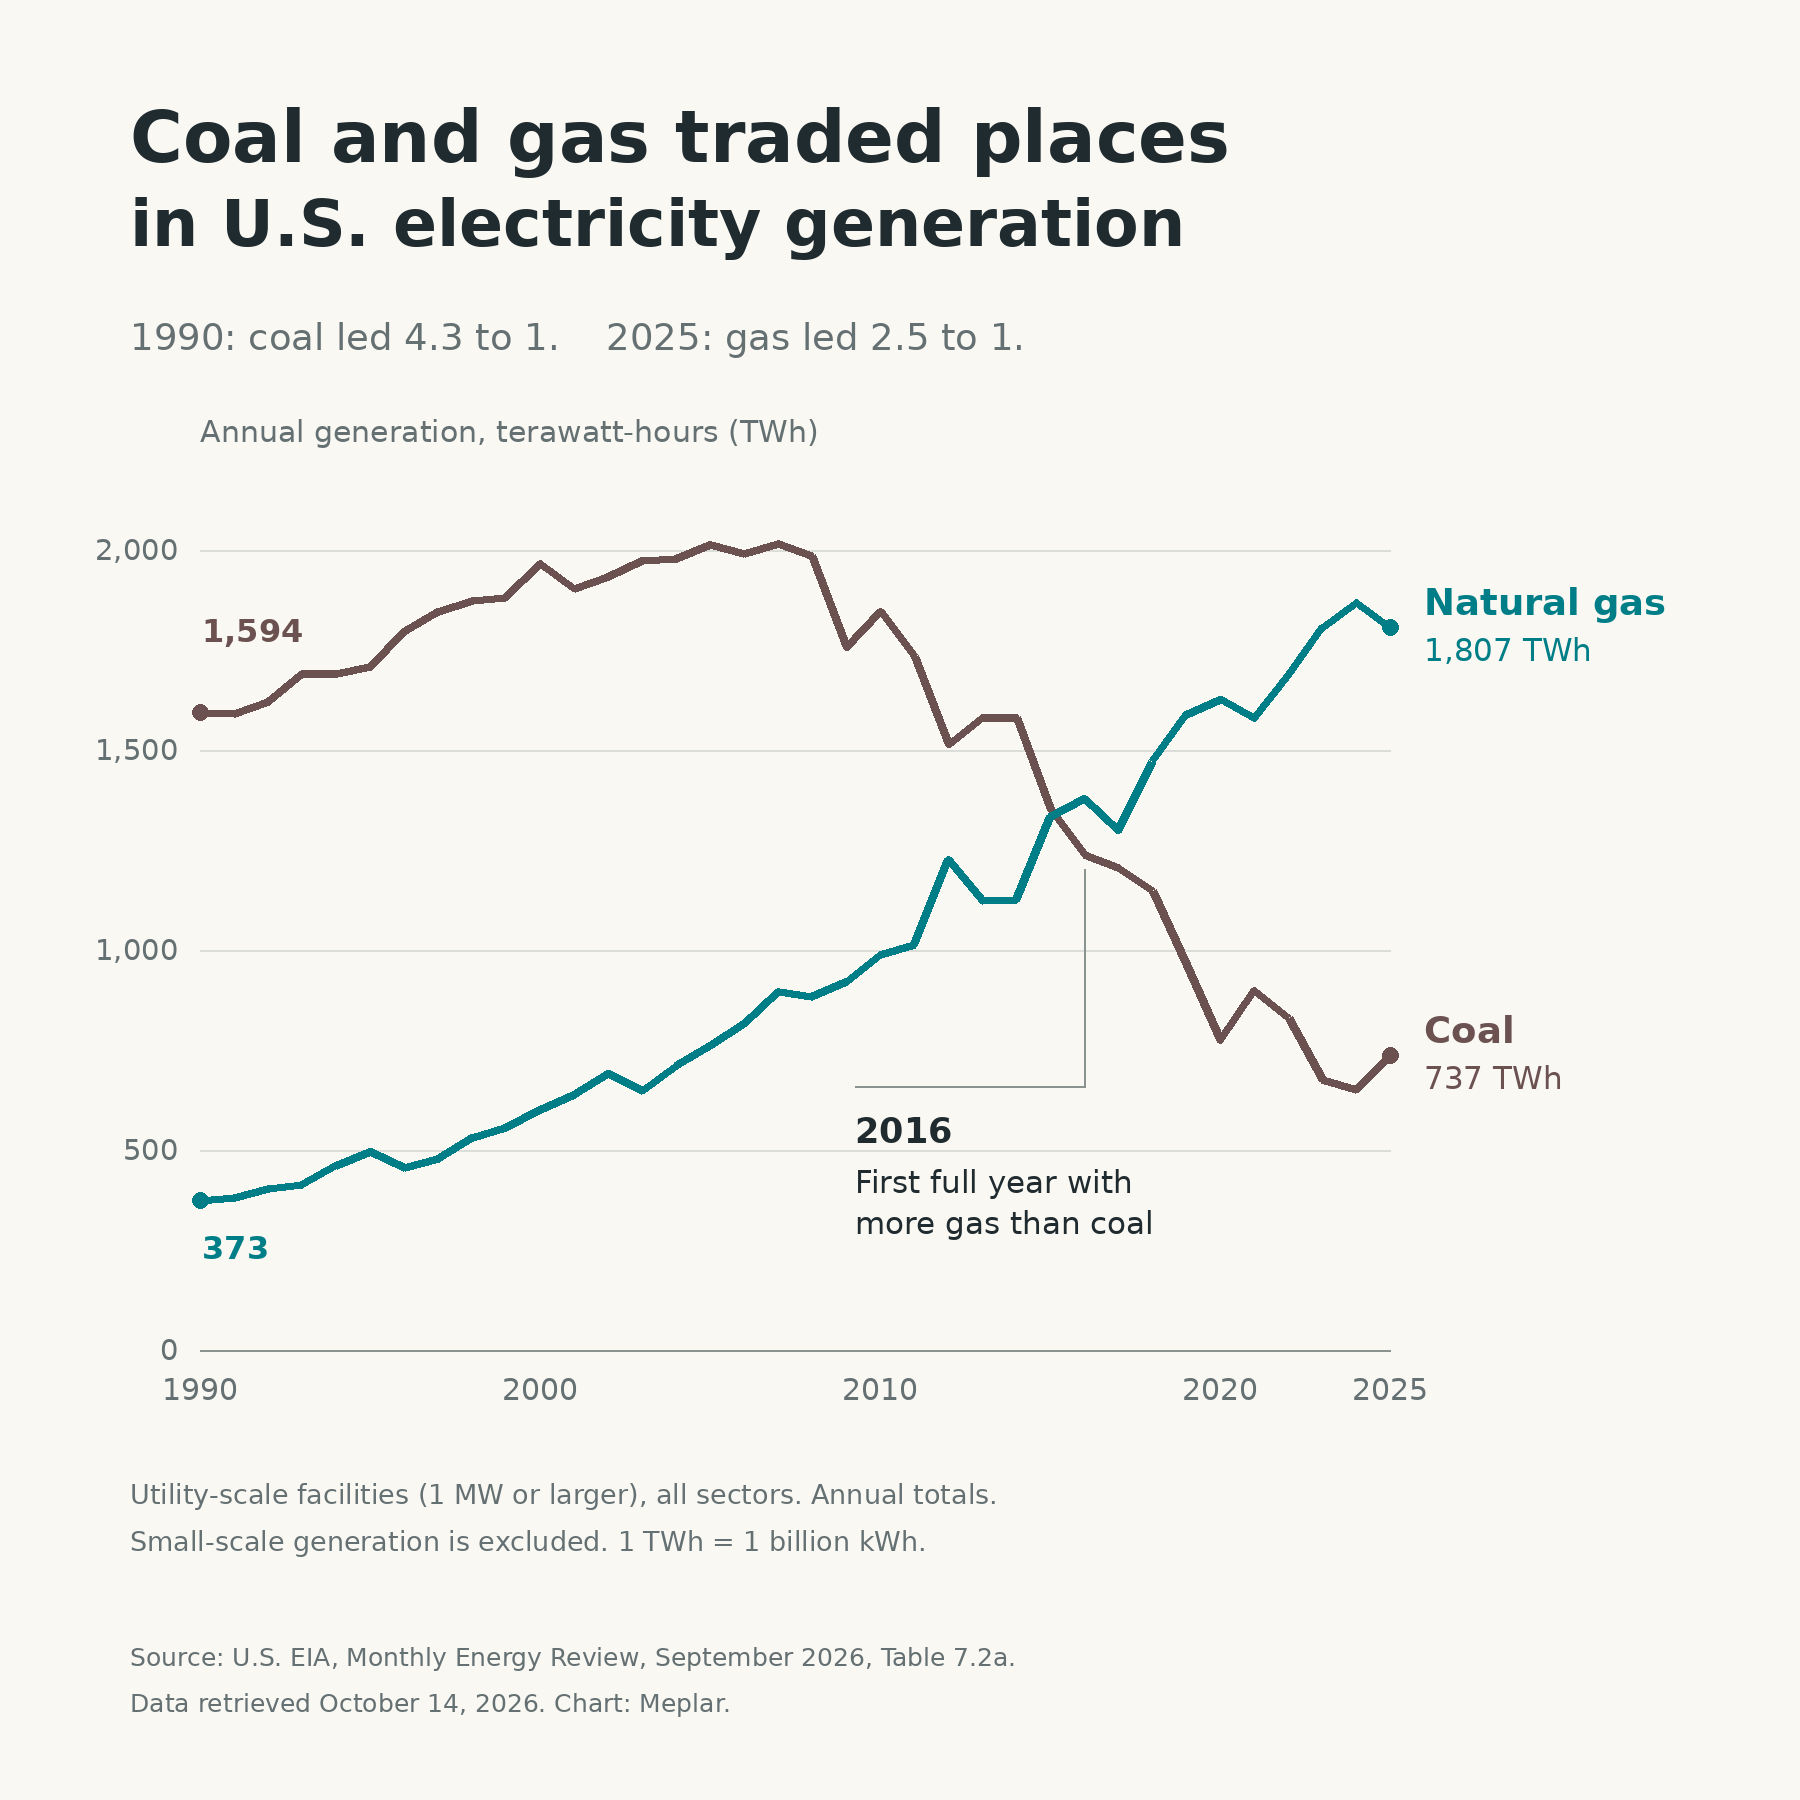
Coal generated 4.3 times as much electricity as natural gas in 1990. By 2025, gas generated 2.5 times as much as coal. The first annual crossover in this series was 2016.
US utility-scale electricity generation, all sectors, 1990–2025. The 50 states and Washington, DC.
How it was made
Select the annual EIA coal, natural-gas and total generation series for 1990–2025. Convert million kilowatthours to TWh. Compare the two fuels using all 36 annual observations.
Definitions & limits
- Utility-scale facilities have at least 1 MW of combined generating capacity; small-scale generation, including rooftop solar, is excluded.
- The fixed source is the September 2026 Monthly Energy Review. Incomplete 2026 monthly observations are excluded.
- The chart measures electricity output and makes no causal claim about one fuel replacing the other.
Original sources
Snapshot date: 2026-10-14. Source releases and observations can be revised; the linked download notes describe this fixed version.