Cars · chart insight
More horsepower. More miles per gallon.
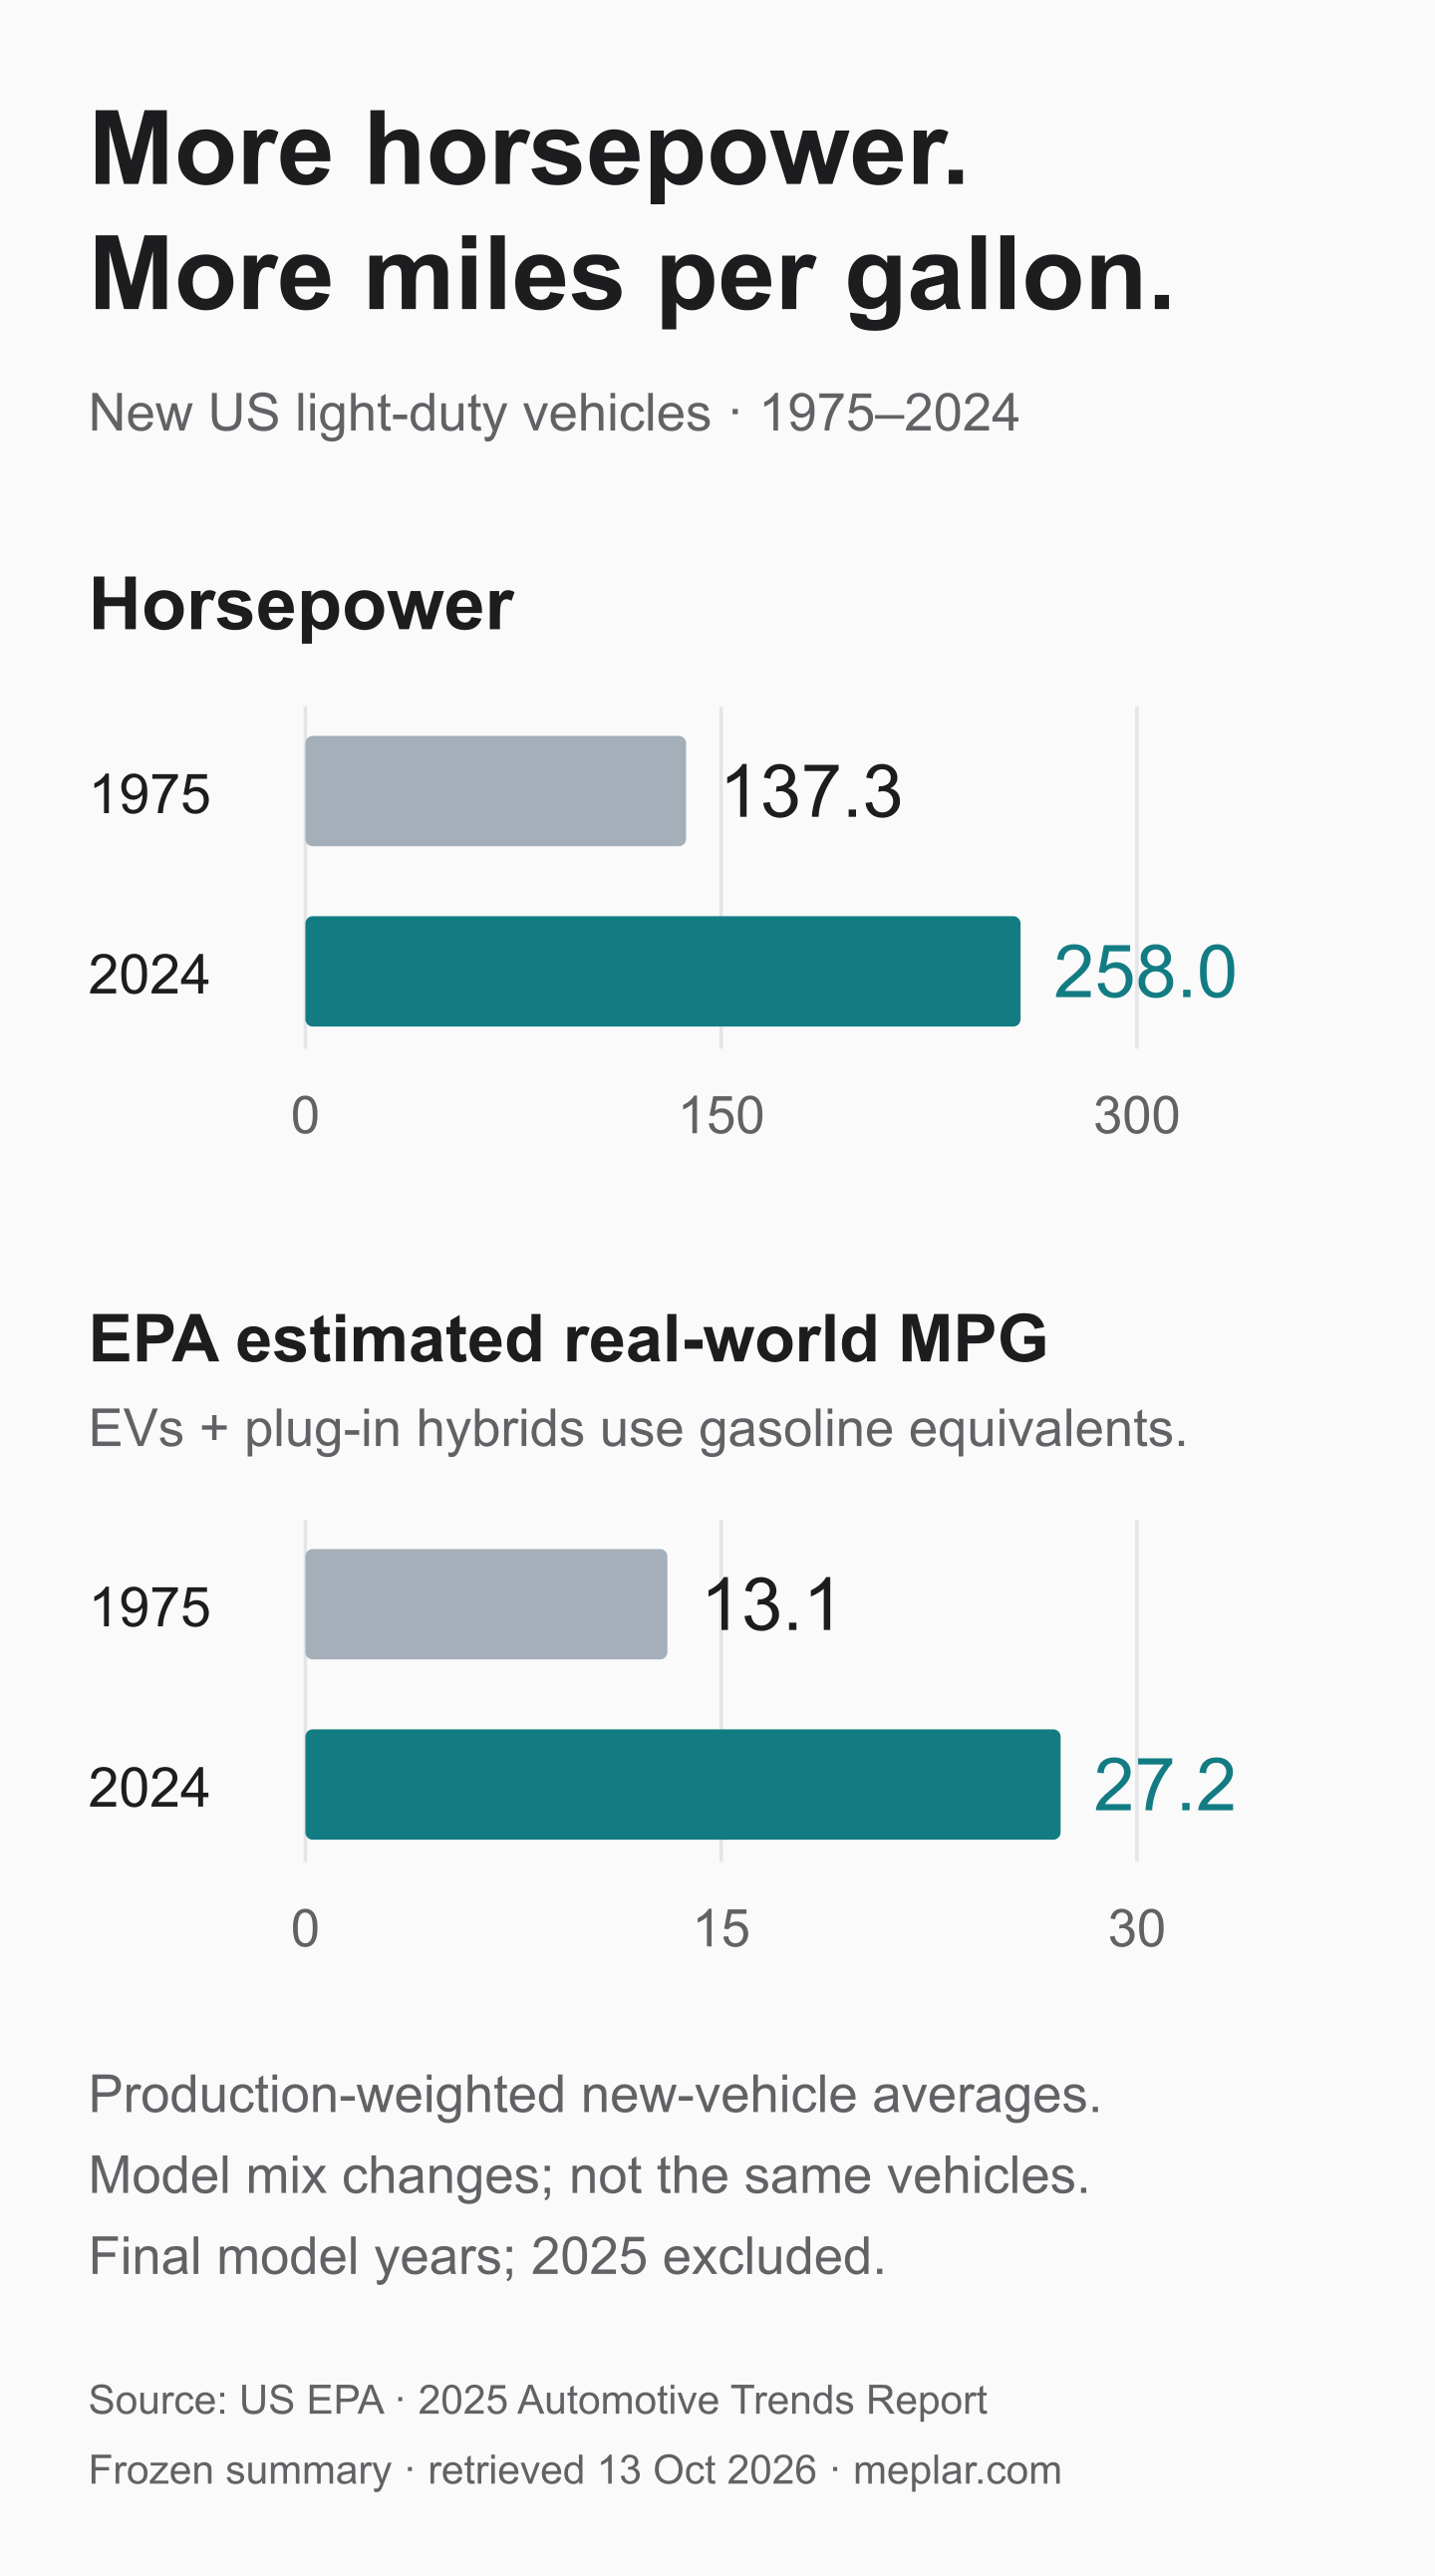
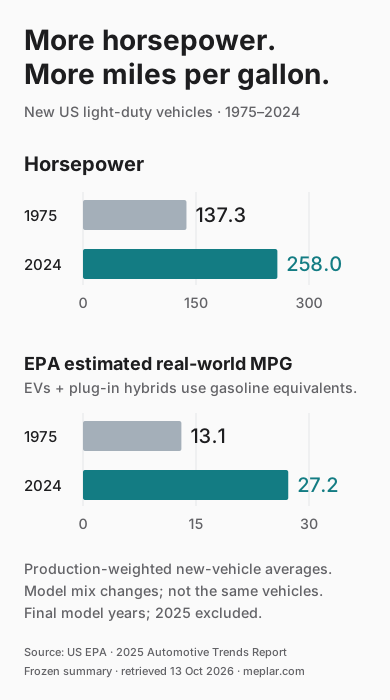
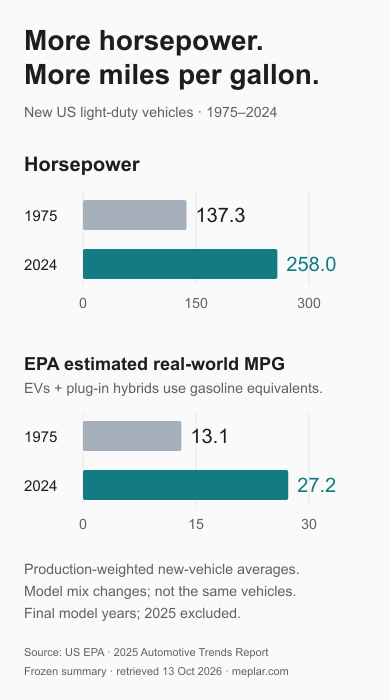
EPA production-weighted averages for new US light-duty vehicles rose from 137.3 to 258.0 horsepower and from 13.1 to 27.2 estimated real-world MPG between model years 1975 and 2024.
 Explore the insight
Source: US EPA · Original frozen dataset
In context. New US light-duty production averages, not the on-road fleet. Battery EVs and plug-in hybrids use gasoline-equivalent energy; 27.2 MPG is not gasoline-only. The model mix changes.
EPA’s reported fuel-economy average more than doubled over this interval, while average horsepower rose by 87.9%. The two gains describe the same new-vehicle production aggregate, measured in different units. This endpoint comparison does not imply that either measure improved in every intervening year; the CSV retains all 50 annual observations.
The mix of vehicles sold changes over time, so this is not a controlled comparison of the same car. The averages cannot isolate the effects of engines, electrification, vehicle size or other changes. EPA includes battery EVs and plug-in hybrids using gasoline-equivalent energy, so fleetwide MPG is not a gasoline-only average. These summaries do not establish literal fuel consumption or emissions.
Files & formats
- chart_data_1975_2024.csv — All 50 annual aggregate observations, with exact source precision.
- plotted_endpoints.csv — The two exact endpoint rows used for the graphic.
- chart.png — Approved chart PNG, 1440 × 2585 pixels.
- chart.svg — Approved scalable SVG, native viewBox 390 × 700; uses installed system fonts.
- chart_mobile390.png — Actual 390 × 700 raster inspected at native size.
- reproduction.zip — Standalone offline reproduction package: this chart, frozen EPA inputs, code and notes.
- README.md — Methods, interpretation, source provenance and reuse.
- SOURCE_TERMS.txt — Retained EPA source attribution and reuse record.
- SOURCE_REFERENCE.json — Machine-readable frozen-source hashes and selection.
- VALIDATION.json — Numerical, archived-source, typography and render checks.
- build_chart.py — Relocatable chart builder; use the reproduction ZIP for its complete frozen inputs.
- SHA256SUMS.txt — SHA-256 hashes of all other public download files.
Method & scope
How it was made
Select the existing EPA All / All production-weighted summary for each final model year 1975–2024. Retain all 50 annual observations and both exact source metrics. Plot only 1975 and 2024, with separate zero-based horsepower and MPG scales and one-decimal display rounding. Do not sum overlapping aggregates, recalculate model-level weights, interpolate or infer emissions. All 100 annual MPG/horsepower values match the archived EPA qMatrix numeric cells.
Definitions & limits
- These are EPA production-weighted averages for new light-duty vehicles delivered for sale in the United States by model year. They are not calendar-year sales totals, an unweighted average over models or the existing road fleet.
- The All / All row is an existing EPA aggregate. All, All Car, All Truck and component vehicle-type rows overlap and must not be summed.
- The chart uses the final 1975 and 2024 endpoints; the download retains every final annual observation from 1975 through 2024. Preliminary 2025 is excluded.
- Horsepower and MPG use different native units and separate zero-based scales. Display labels round to one decimal; both CSVs preserve source precision.
- The mix of models, types and powertrains changes. This is not a matched-vehicle or causal estimate and does not establish uninterrupted growth.
- EPA’s official report, printed page 6 footnote 1 (PDF page 12), includes battery-electric and plug-in hybrid MPGe in fleetwide MPG unless otherwise noted. This chart does not reproduce the full adjustment formula. Do not convert the aggregate MPG to literal gasoline consumption, CO₂ emissions or mechanical efficiency.
- Source values can be revised. This analysis uses the fixed EPA summary retrieved on 13 October 2026, not a new data collection.
Original Meplar analysis/design with AI assistance from ChatGPT/Codex. Tools: Python standard library, Decimal arithmetic, local librsvg and Poppler. I run Meplar. No paid assets, services or API calls were used.
Fields & examples
model_year | EPA model year; all final years 1975–2024 are retained. |
|---|---|
regulatory_class | Original EPA regulatory class; All for every selected row. |
vehicle_type | Original EPA vehicle-type aggregate; All for every selected row. |
production_share | Source share of new light-duty production; 1 for this All / All aggregate. |
real_world_mpg | EPA estimated real-world fleetwide MPG. Battery EVs and plug-in hybrids use gasoline-equivalent energy (MPGe); this is not a gasoline-only average. Exact reported source value. |
horsepower | EPA production-weighted average horsepower (HP); exact reported source value. |
The annual CSV retains 50 rows. The endpoint CSV contains only the 1975 and 2024 rows shown in the chart, at the same exact source precision.
Sources & reuse
Original sources
- US EPA, 2025 Automotive Trends Report data
- EPA Automotive Trends definitions
- EPA Standard Open Data License
- EPA report, printed page 6 footnote 1: MPG includes BEV/PHEV MPGe
Fixed EPA summary retrieved on 13 October 2026. The reproduction ZIP includes the unchanged frozen source CSV and original archived source package. The numeric inputs were not re-fetched. Selection and all 100 annual metric values were independently checked against the archived EPA numeric cells.
US Environmental Protection Agency, 2025 Automotive Trends Report. Source: https://www.epa.gov/automotive-trends/explore-automotive-trends-data EPA data licensing: https://edg.epa.gov/EPA_Data_License.htm EPA-produced data are generally U.S. public-domain material unless otherwise specified in the source metadata. EPA provides data without a warranty; evaluate the original metadata for intended uses or restrictions. No contrary data-specific restriction was found in the archived source. Credit EPA and retain the method and modification notes. No EPA endorsement or logo.
Download source and reuse record · Complete method and reproduction notes