Dataset / Economy
EU27 food price levels.
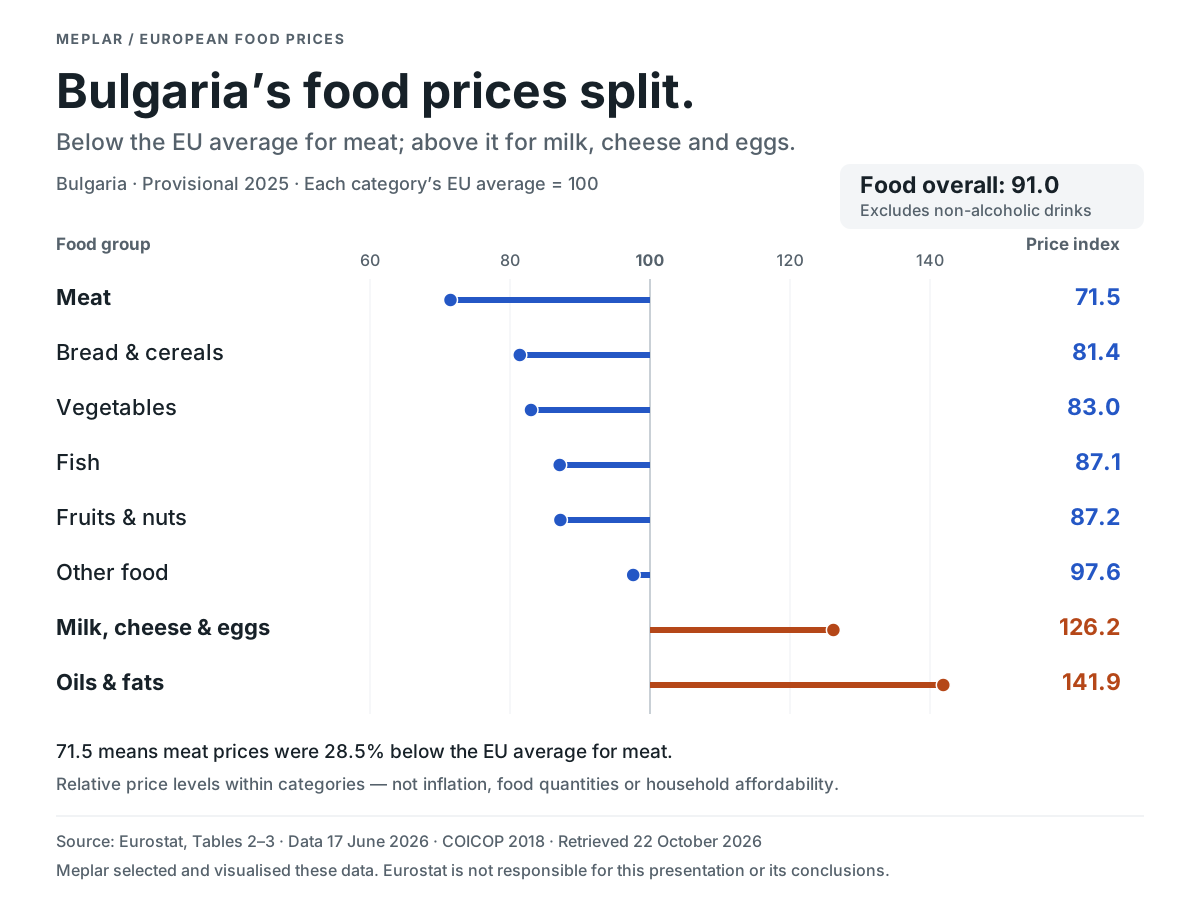
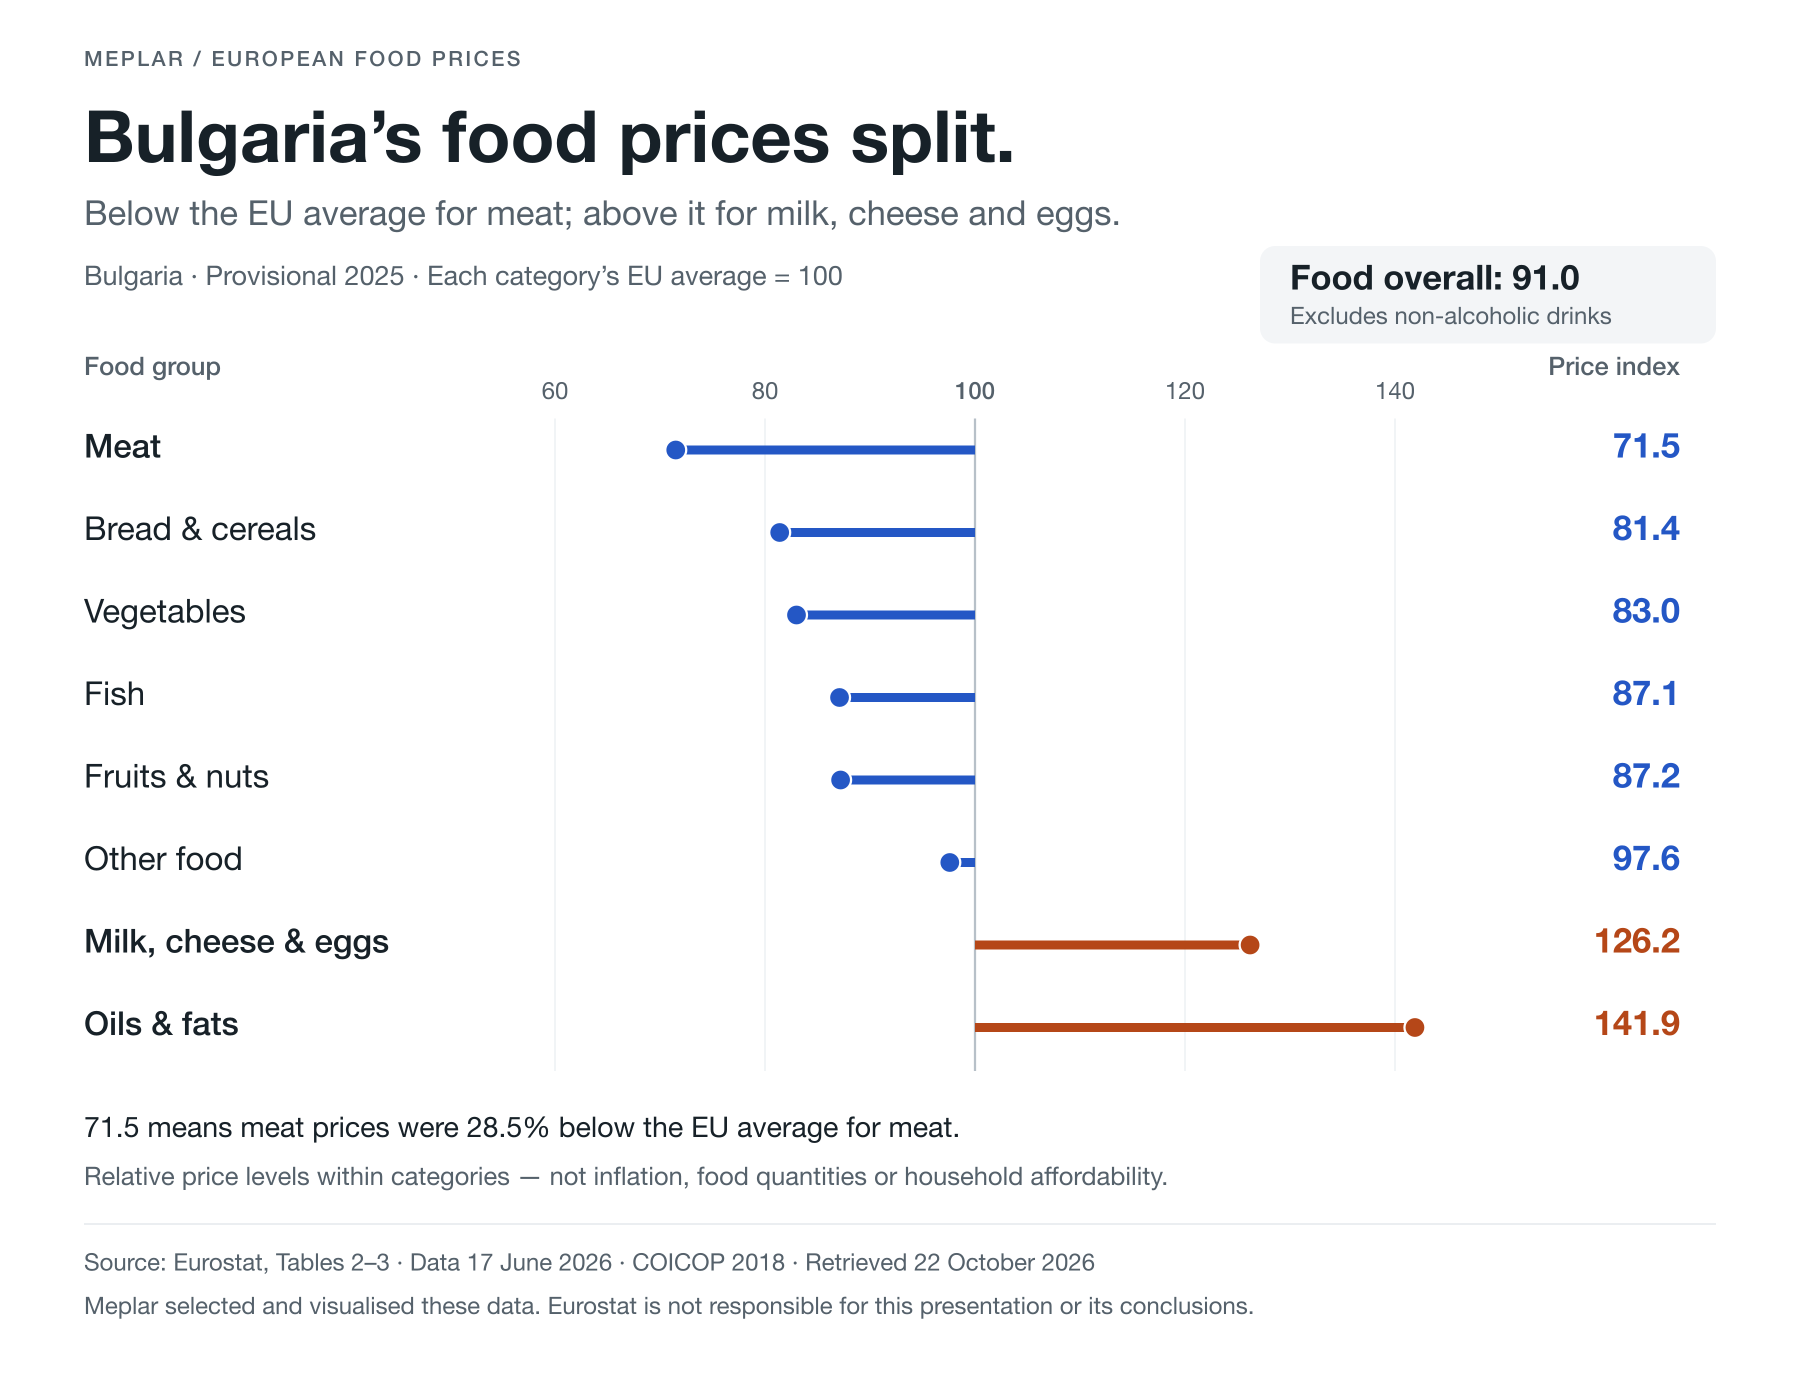
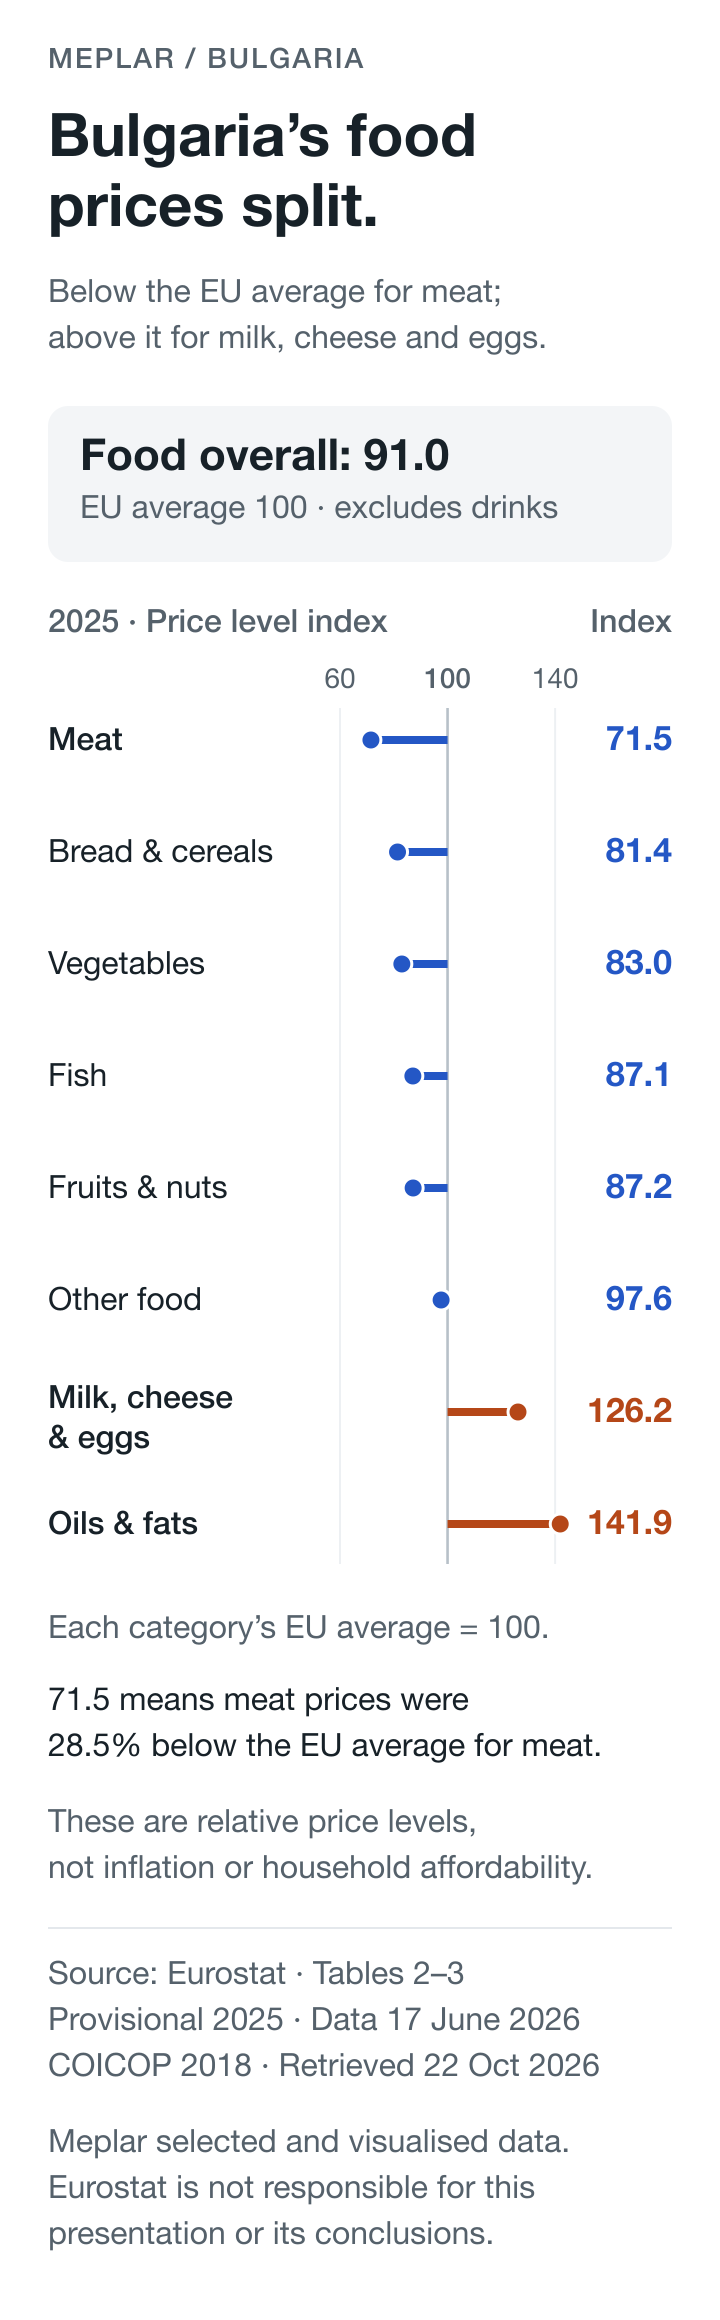
Provisional 2025 · Food and eight published food groups · Each category’s EU average = 100
Source and method
Provisional 2025 price level indices from the Eurostat workbook accompanying its article with data from 17 June 2026. Frozen workbook retrieved 22 October 2026.
Price level index = purchasing power parity divided by the annual average exchange rate, expressed relative to the EU average of 100. Each food group has its own EU benchmark. The EU benchmark is expenditure-weighted and corrected for price level differences.
Food and eight published food groups come from Tables 2–3. The separate food-and-non-alcoholic-beverages field comes from Figure 1. Bulgaria food is 91.0; food and non-alcoholic beverages is 92.6. These aggregates are not interchangeable.
The classification is COICOP 2018, used for these analytical categories from 2022. This is a 2025 cross-section and splices no earlier classification or time series.
Extracted values are displayed to one decimal, matching the workbook number format 0.0. Percent difference from the category EU average is index minus 100. No missing cells or interpolated values occur in the selected EU27 fields.
This is a comparison of price levels, not inflation, household affordability, food quantities, spending shares or the absolute cost of different categories. Close index differences do not establish statistically significant country rankings.
The chart shows all eight published groups for Bulgaria. The CSV includes the same fields for all 27 EU countries; EFTA/candidate-country and EA21 aggregate rows are excluded from that CSV. The original workbook is retained unchanged in the source ZIP.
Formula: percent difference = price_index_eu100 − 100. Thus 71.5 means 28.5% below the EU category average; 126.2 means 26.2% above it.
Source tables have no missing values among the 27 × 9 selected food fields or 27 combined-food-and-beverage fields. No observations are filled, interpolated or invented.
Fields and files
eu27-food-price-levels.csv:27 rows,12 columns: country, year, 9 food fields and 1 separate combined-food-and-beverages field.
source-extract.csv:297 workbook cell records, including the duplicated Food aggregate from Tables 2–3 as a cross-check.
bulgaria-chart-data.csv:8 food-group rows in chart order.
- country / year
- EU country name and observation year 2025. Twenty-seven country rows; EA21, EFTA and candidate-country rows are excluded.
- food
- Food price level index, excluding non-alcoholic beverages. EU=100.
- bread_and_cereals
- Bread and cereals price level index. This category’s own EU average = 100.
- meat
- Meat price level index. This category’s own EU average = 100.
- fish
- Fish price level index. This category’s own EU average = 100.
- milk_cheese_and_eggs
- Milk, cheese and eggs price level index. This category’s own EU average = 100.
- oils_and_fats
- Oils and fats price level index. This category’s own EU average = 100.
- fruits_and_nuts
- Fruits and nuts price level index. This category’s own EU average = 100.
- vegetables
- Vegetables price level index. This category’s own EU average = 100.
- other_food
- Other food price level index. This category’s own EU average = 100.
- food_and_non_alcoholic_beverages
- Separate combined aggregate from Figure 1; not interchangeable with food. EU=100.
- percent_above_or_below_eu_average
- In bulgaria-chart-data.csv only: price_index_eu100 minus 100, expressed in percent. The field is a relative price-level difference, not inflation.
- raw_xml_value / display_index_eu100
- In source-extract.csv: original OOXML numeric serialization and one-decimal display value respectively. Sheet, cell and source_label locate every original cell.
Source access
Reproducibility and reuse
Unpack the ZIP in an empty directory and run python3 reproduce.py --out reproduced. It verifies the source-workbook SHA-256, parses OOXML with Python’s standard library and rebuilds three CSVs and two SVGs offline. No network, account or credentials are required. Optional PNG rendering needs an existing rsvg-convert installation and matching fonts; reviewed PNGs are retained in the package.
Meplar selected and visualised these data. Eurostat is not responsible for Meplar’s presentation or conclusions. Statistical data reuse follows the linked Eurostat policy; no agency logo or third-party photograph is used.
README · Metadata · Source provenance · Source terms · SHA-256 checksums
Take a closer look.
Original chart, the complete EU27 food-category extract and frozen source workbook.