Food & everyday life / Bulgaria

Bulgaria’s food prices split.

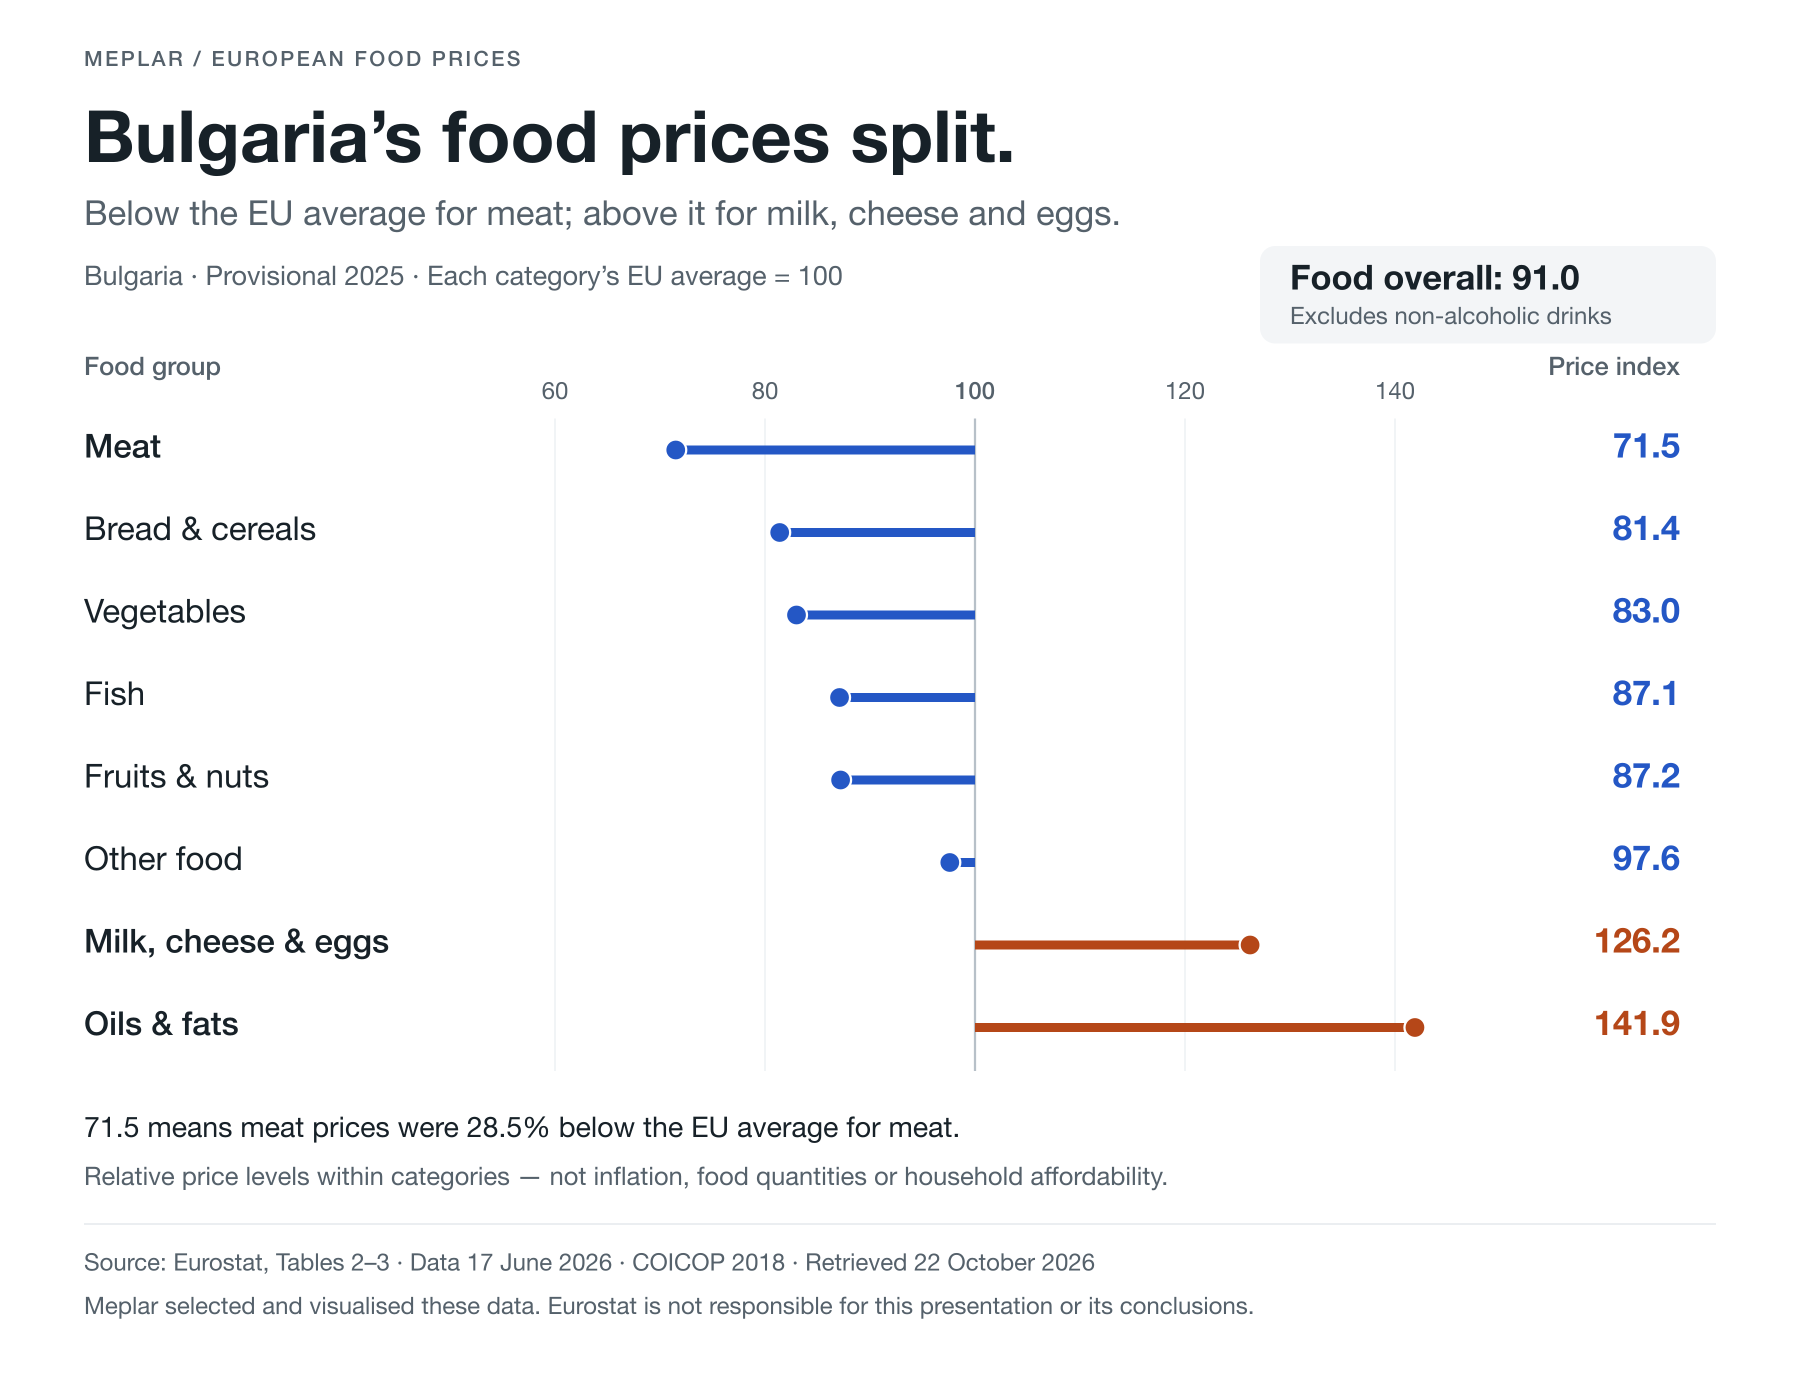
Bulgaria’s provisional 2025 price indices: meat 71.5, milk, cheese and eggs 126.2, oils and fats 141.9. Each category’s EU average = 100.

Provisional 2025 · Data 17 June 2026 · COICOP 2018 · Source retrieved 22 October 2026

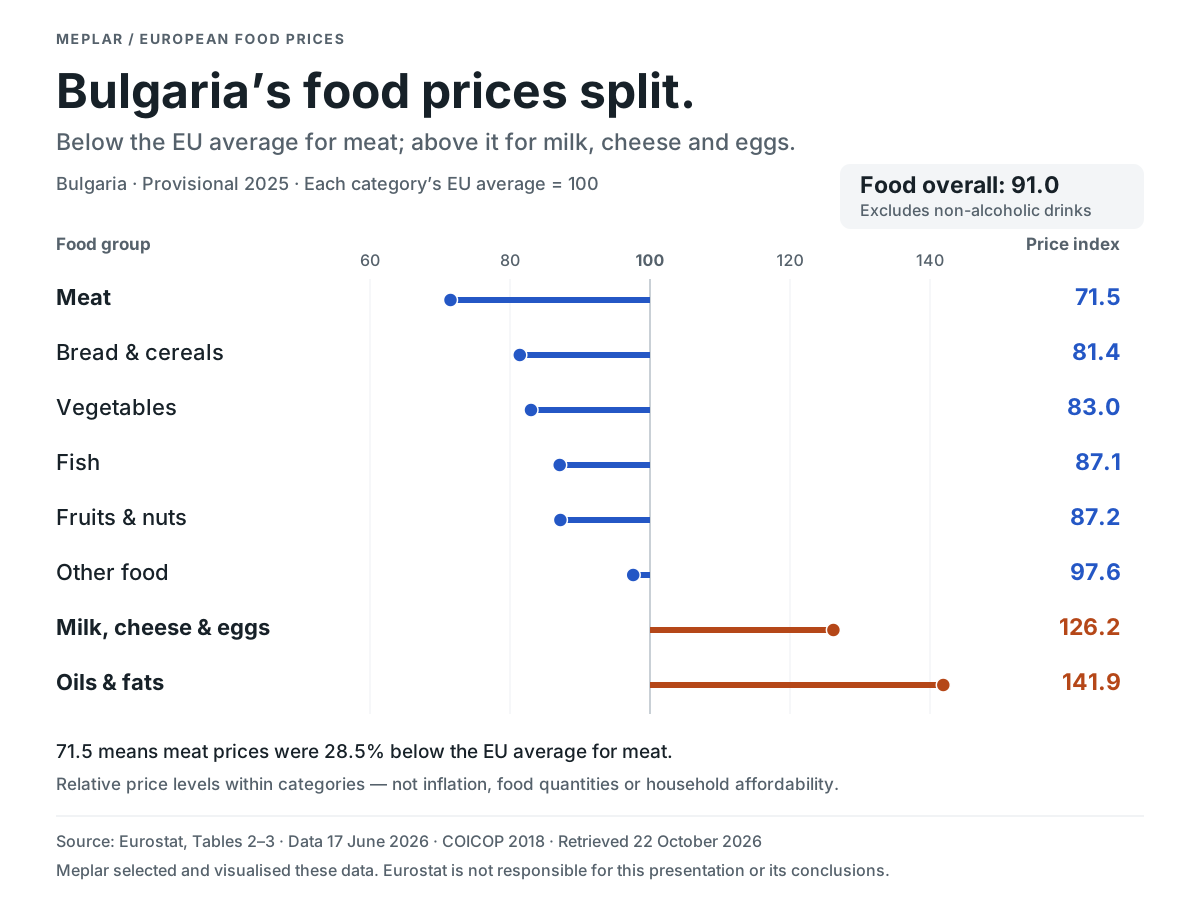
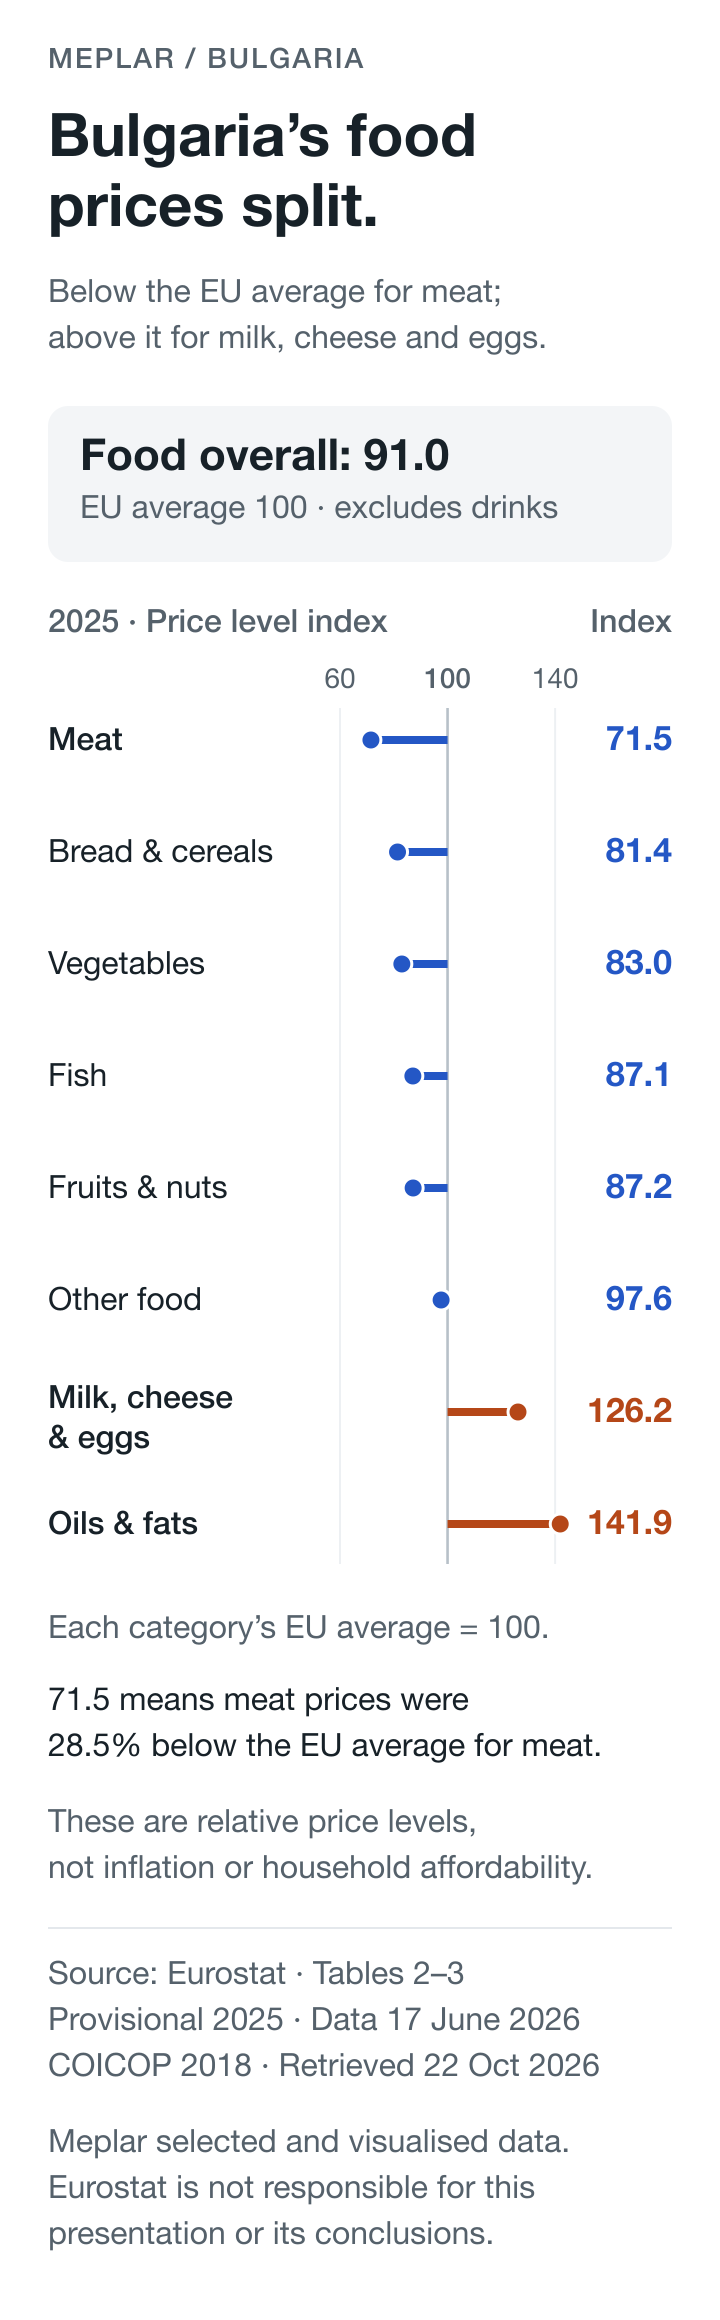
Bulgaria, provisional 2025 price level indices, EU average 100 within each category. Meat 71.5; bread and cereals 81.4; vegetables 83.0; fish 87.1; fruits and nuts 87.2; other food 97.6; milk, cheese and eggs 126.2; oils and fats 141.9. Food overall 91.0.
Each food group is compared with its own EU average. The numbers do not compare the absolute cost of meat with dairy. Open full-size SVG

One national average hides a split.

Bulgaria’s food price index was 91.0, or 9.0% below the EU average for food. Yet milk, cheese and eggs were 26.2% above their EU average, and oils and fats 41.9% above.

Meat was 28.5% below the EU average for meat. Bread and cereals, vegetables, fish, fruits and nuts, and other food were also below their respective EU averages.

This is a 2025 comparison of price levels across countries. It does not measure how prices changed, what households earned or how affordable food was.
Source, scope and provisional status

Provisional 2025 price level indices from the Eurostat workbook accompanying its article with data from 17 June 2026. Frozen workbook retrieved 22 October 2026.

Food and eight published food groups come from Tables 2–3. The separate food-and-non-alcoholic-beverages field comes from Figure 1. Bulgaria food is 91.0; food and non-alcoholic beverages is 92.6. These aggregates are not interchangeable.

The classification is COICOP 2018, used for these analytical categories from 2022. This is a 2025 cross-section and splices no earlier classification or time series.

What the index means

Price level index = purchasing power parity divided by the annual average exchange rate, expressed relative to the EU average of 100. Each food group has its own EU benchmark. The EU benchmark is expenditure-weighted and corrected for price level differences.

Extracted values are displayed to one decimal, matching the workbook number format 0.0. Percent difference from the category EU average is index minus 100. No missing cells or interpolated values occur in the selected EU27 fields.

This is a comparison of price levels, not inflation, household affordability, food quantities, spending shares or the absolute cost of different categories. Close index differences do not establish statistically significant country rankings.

Downloads, reproduction and reuse

The chart shows all eight published groups for Bulgaria. The CSV includes the same fields for all 27 EU countries; EFTA/candidate-country and EA21 aggregate rows are excluded from that CSV. The original workbook is retained unchanged in the source ZIP.

Download the versioned ZIP for the unchanged source workbook, three CSVs, SVG/PNG charts, provenance, terms and an offline standard-library reproduction script. CSVs and SVGs reproduce exactly; PNG rendering uses librsvg and system fonts.

Meplar selected and visualised these data. Eurostat is not responsible for Meplar’s presentation or conclusions. Statistical data reuse follows the linked Eurostat policy; no agency logo or third-party photograph is used.

README · Metadata · Provenance · Checksums · Full data & methods

Take a closer look.

Original chart, the complete EU27 food-category extract and frozen source workbook.

Chart