Messi and Ronaldo, 2017/18: chart data and methods
Plotted tables and selected event audits for Wyscout-based analyses of Messi and Ronaldo in the 2017/18 domestic season.
- 2017/18 · Five domestic leagues; Ronaldo analyses: LaLiga
- Plotted CSVs, selected audits and a reproduction ZIP
Includes the supplied plotted tables, selected audit trails, chart variants, source metadata and reproduction files. The expanded original raw-event archive is not included.
Ranked take-on totals · Club/player free-kick totals · Grouped shot locations · Schematic non-penalty dots.
1. Messi’s take-ons won
2017/18 season · Big Five leagues
View chart and original exports
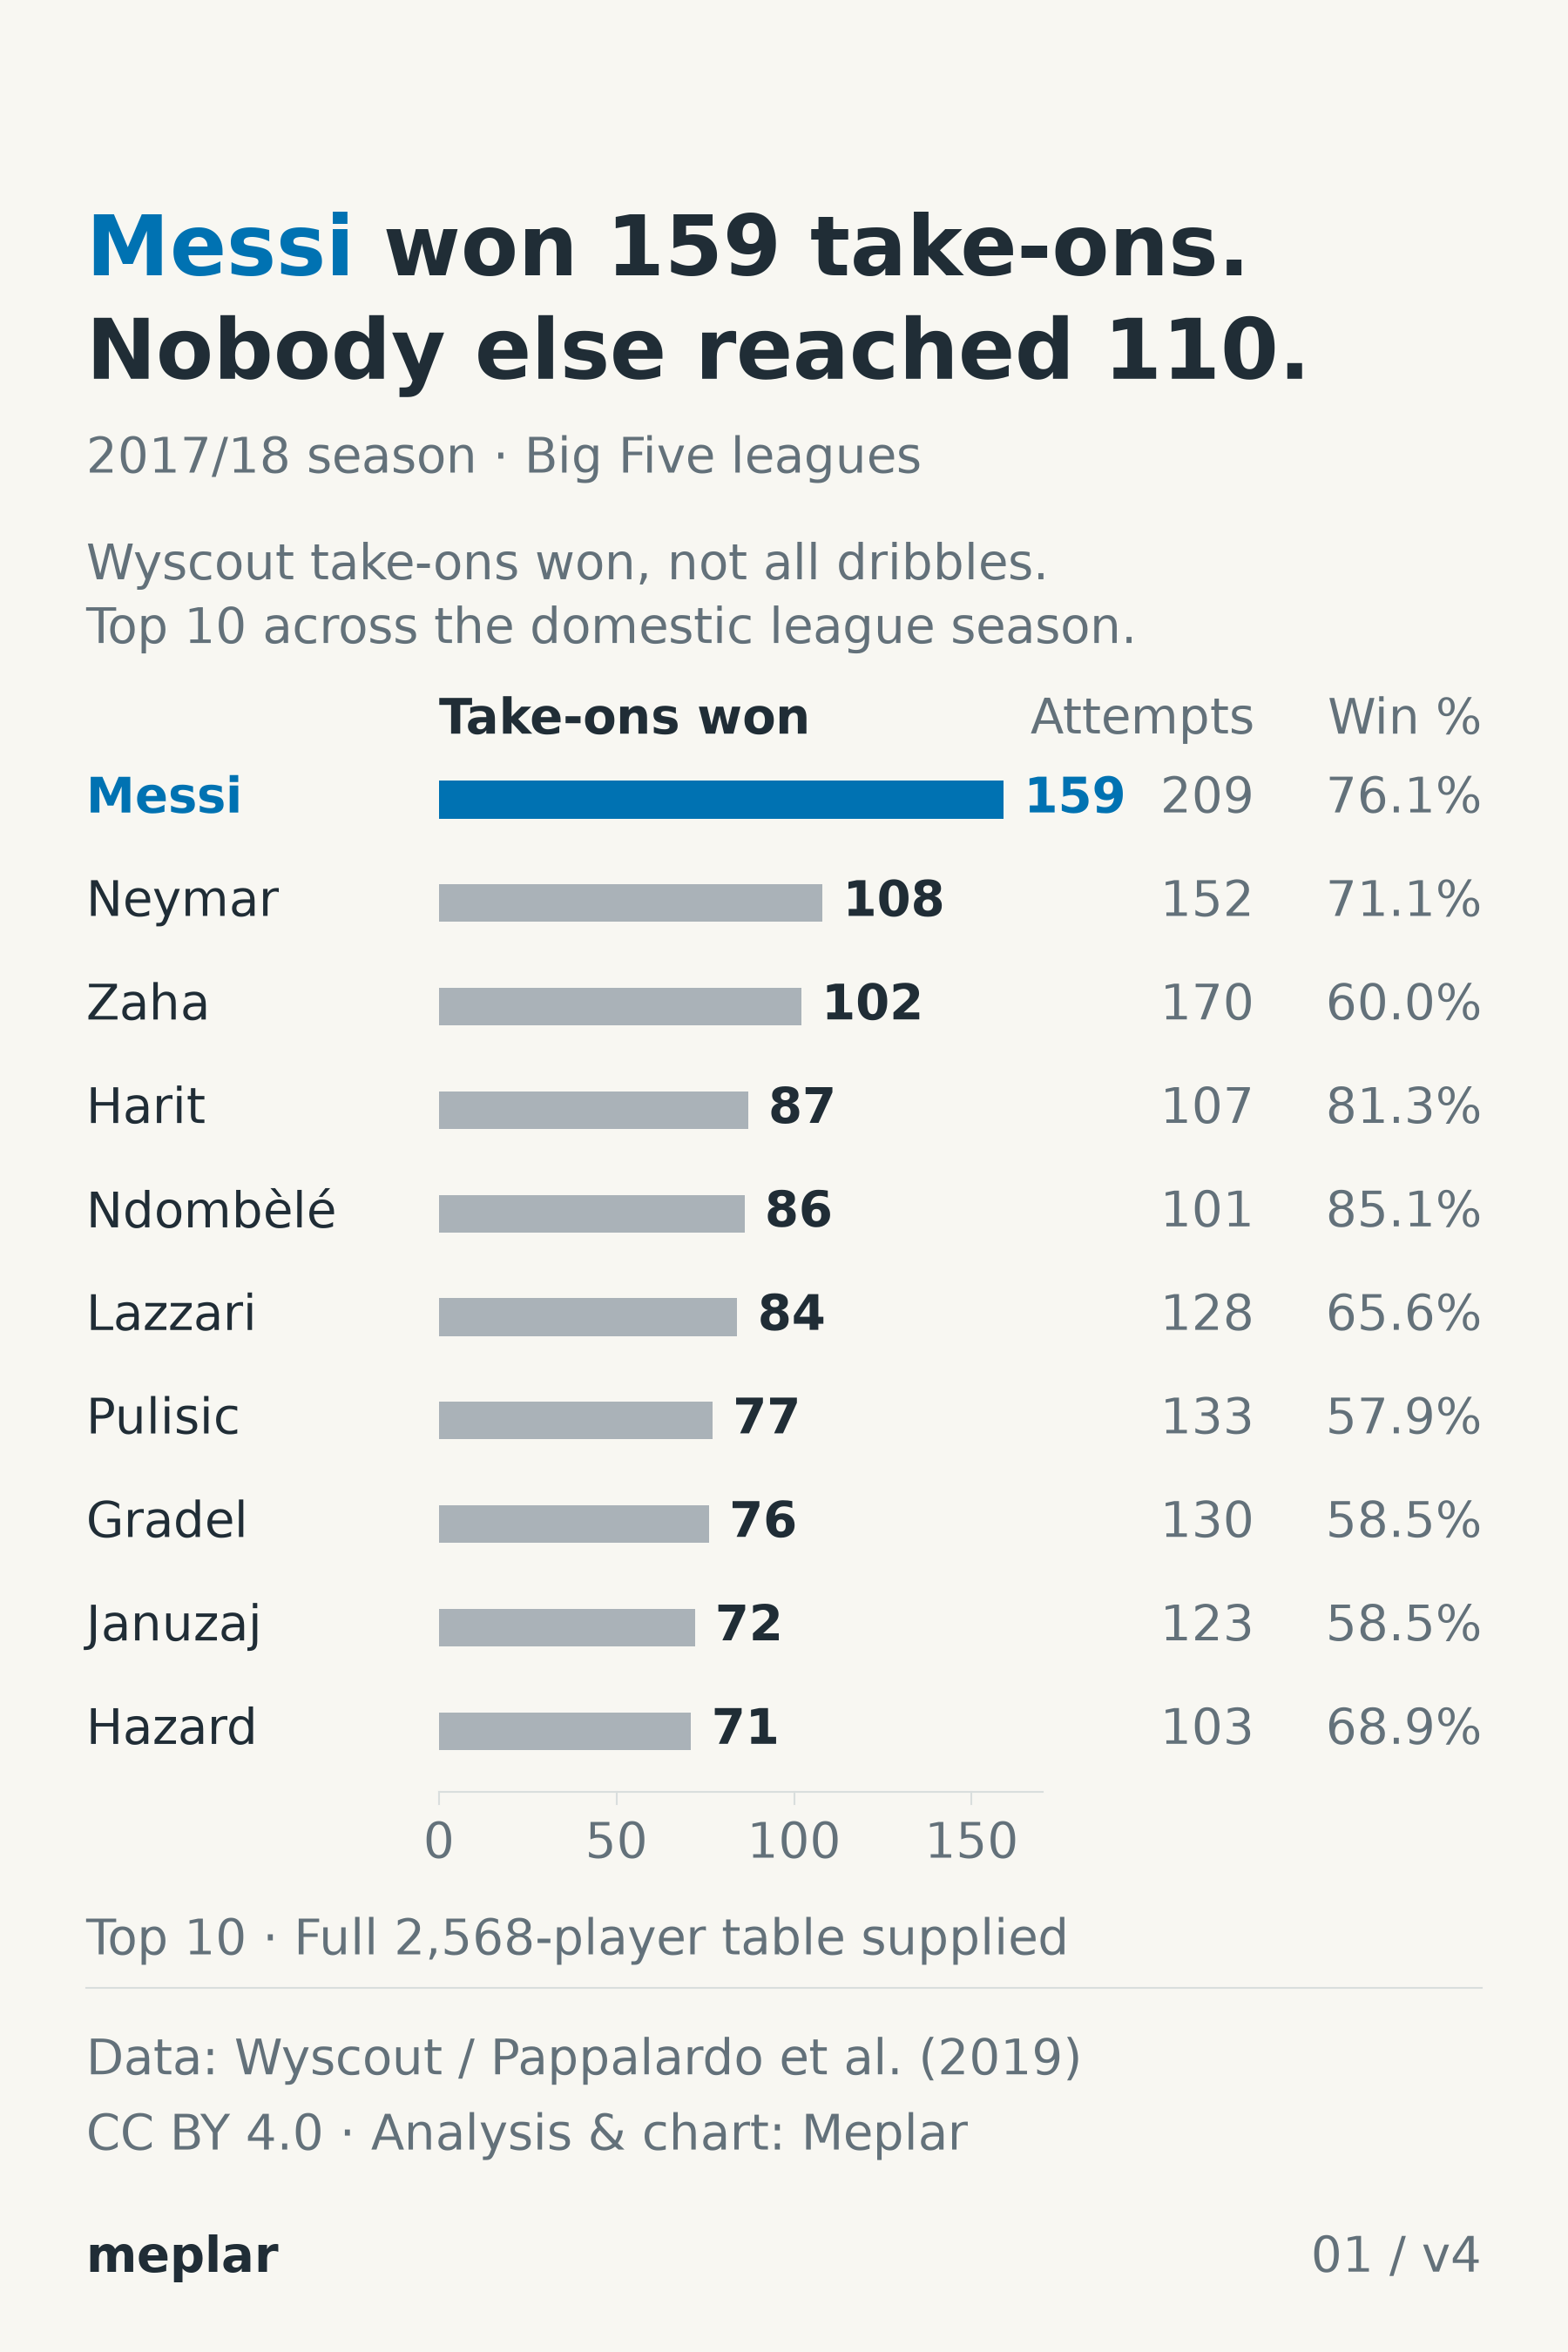
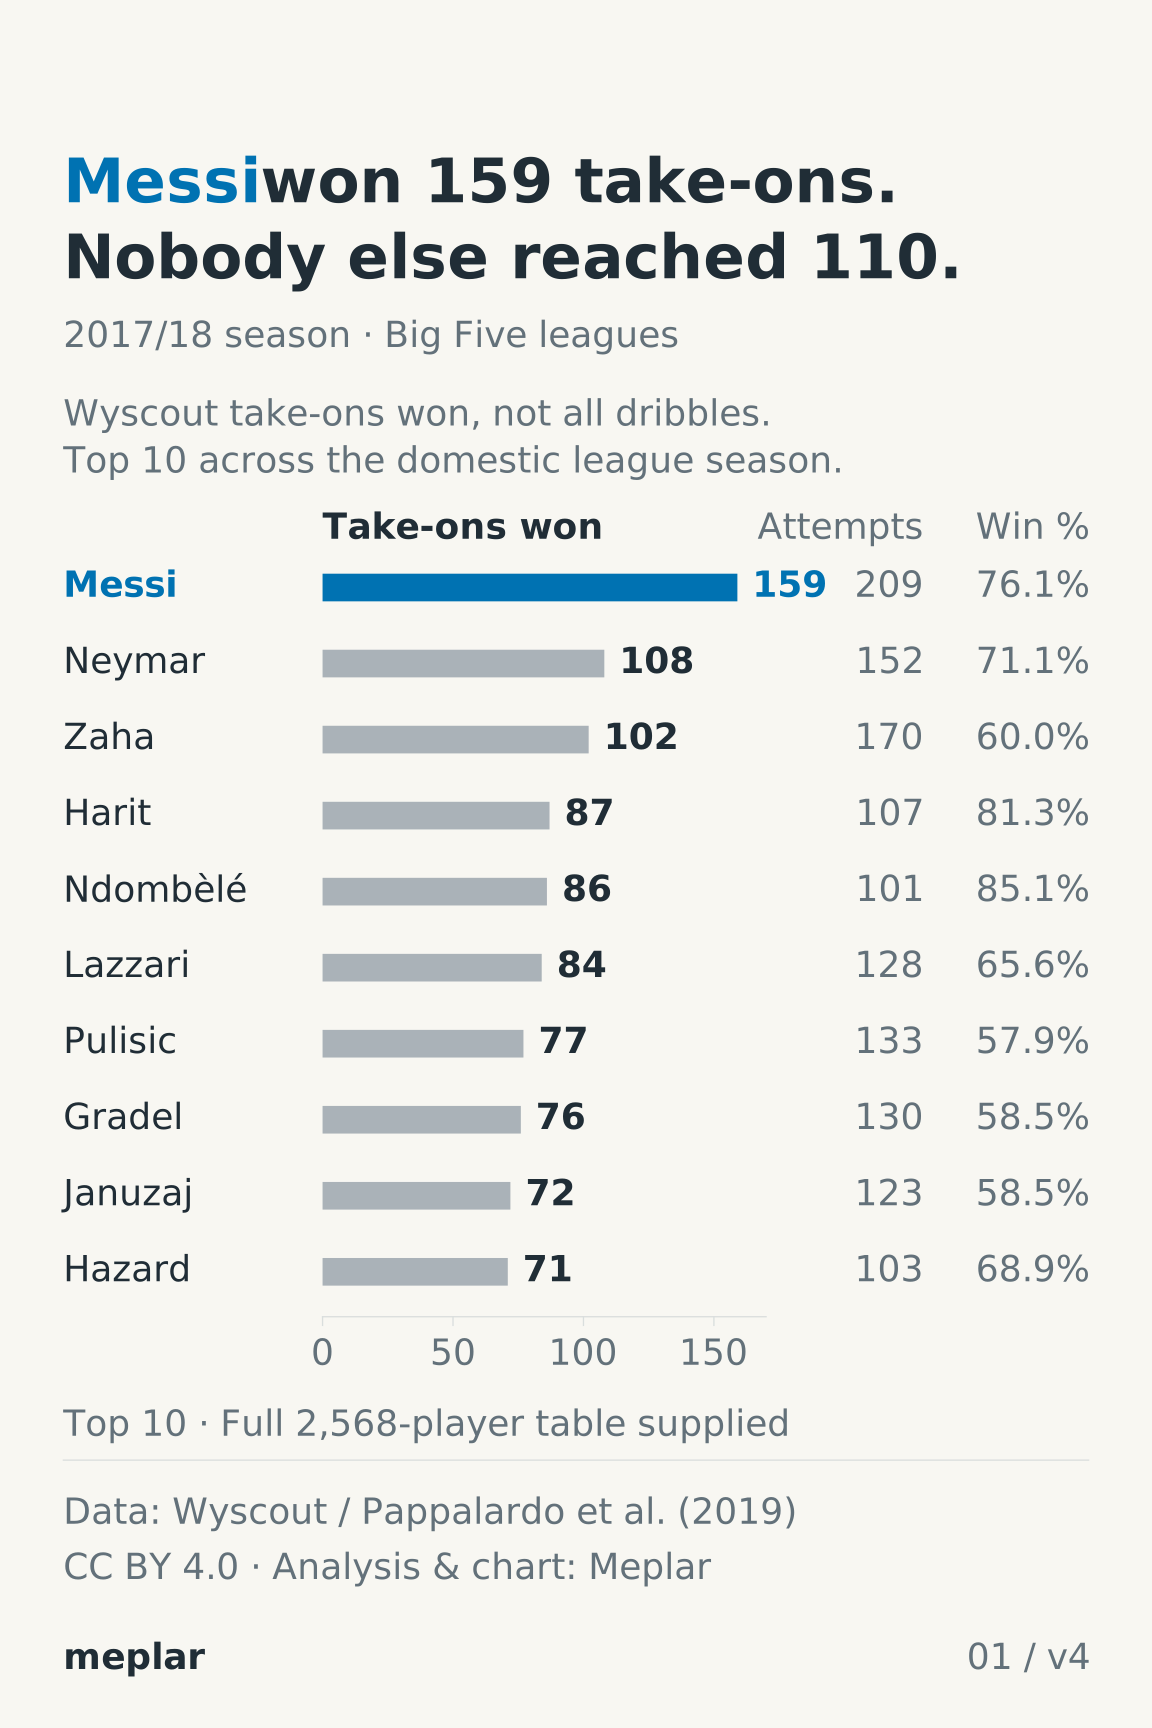
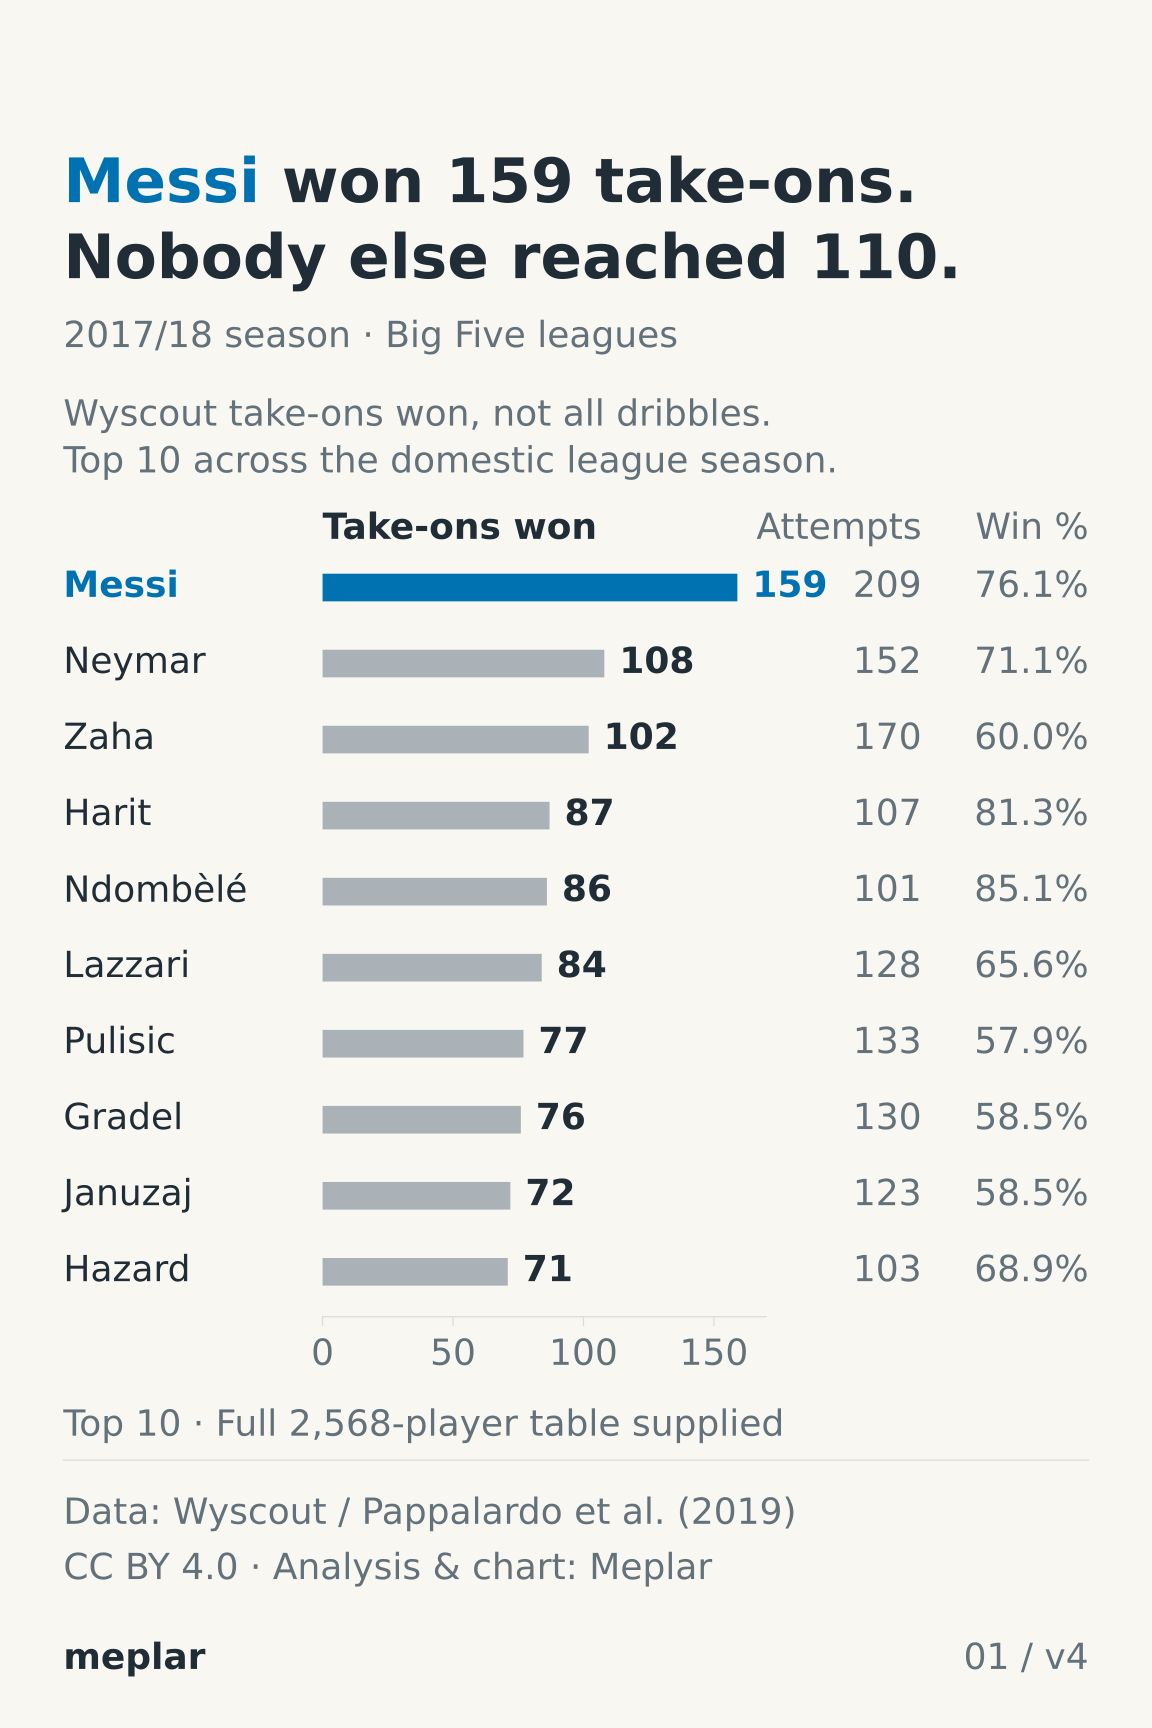
plotted_data/01_plotted_top10_take_ons.csv contains the ten highest take-on-win totals from all 2,568 distinct nonzero player IDs in the five leagues. The complete cohort CSV includes zero-take-on players; 2,163 players attempted at least one. There is no minimum-minute or attempt threshold. The tenth player has 71 wins; the next players have 70, so there is no tie at the cutoff.
- player_id / player_name
- Provider player identifier and display name. Cross-league transfers are combined by player ID; shortened chart names are display labels.
- leagues
- Semicolon-separated, sorted domestic-league labels in which the player has recorded events.
- take_on_attempts
- Strict legacy-provider subset: subEventId 11 (ground attacking duel), with tag 503 or 504 (take-on left/right). This is not every dribble or every attacking duel.
- take_ons_won
- Qualifying attempts carrying won tag 703. Accurate tag 1801 is a distinct measure that includes neutral outcomes and is not substituted for a win.
- take_ons_not_won
- Attempts minus wins, including both neutral and lost outcomes. Messi’s 50 not-won attempts comprise nine neutral outcomes and 41 losses; calling all 50 losses would be incorrect.
- win_percentage
- 100 × wins ÷ attempts, retained to six decimal places in these tables and rounded to one decimal on the chart. Blank when attempts are zero, rather than a measured 0%.
- appearances_with_events
- Number of distinct match IDs with recorded player events, combined across leagues. This is not official appearance or minutes data and is not an exposure adjustment.
For Messi, 159 ÷ 209 × 100 ≈ 76.076555%, displayed as 76.1%. Neymar’s 108 wins from 152 attempts give 71.1%. The 51-win lead is a season-total comparison. Harit and Ndombèlé have higher observed win percentages than Messi; the chart ranks wins, not rates or per-90 performance. Messi and Neymar have 36 and 20 appearances with recorded events respectively.
2. Messi and clubs on direct free kicks
2017/18 season · Big Five leagues
View chart and original exports
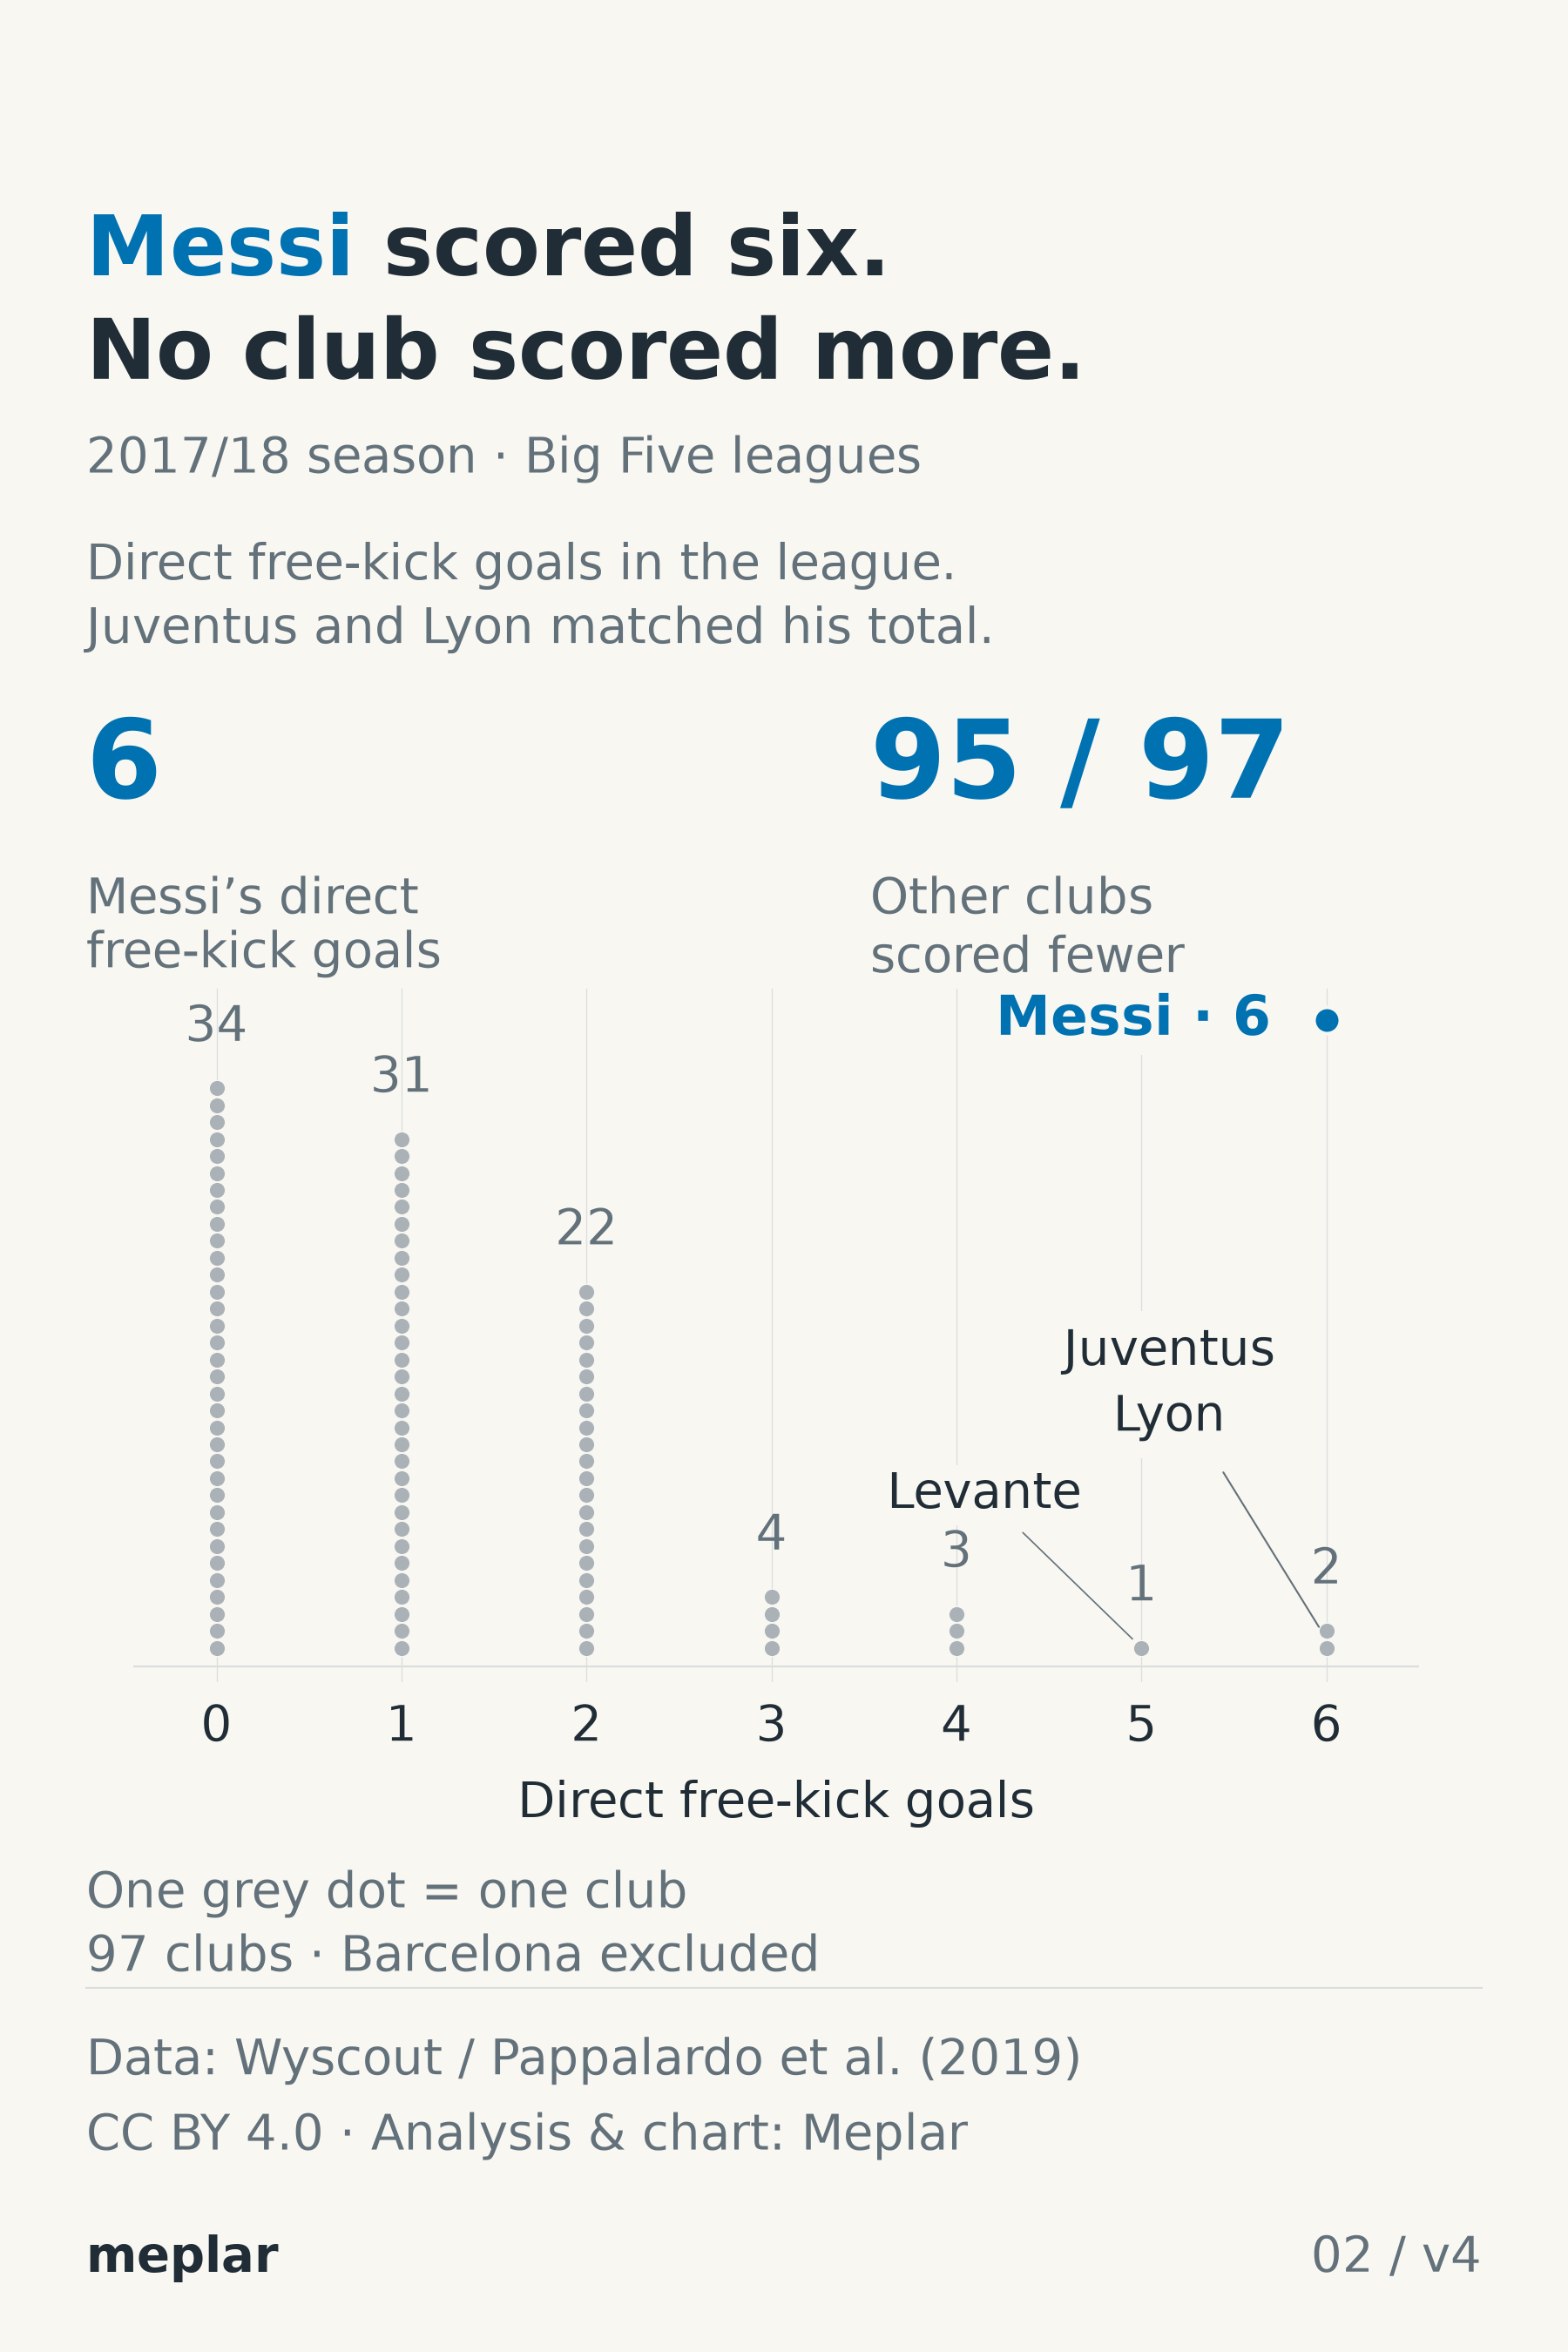
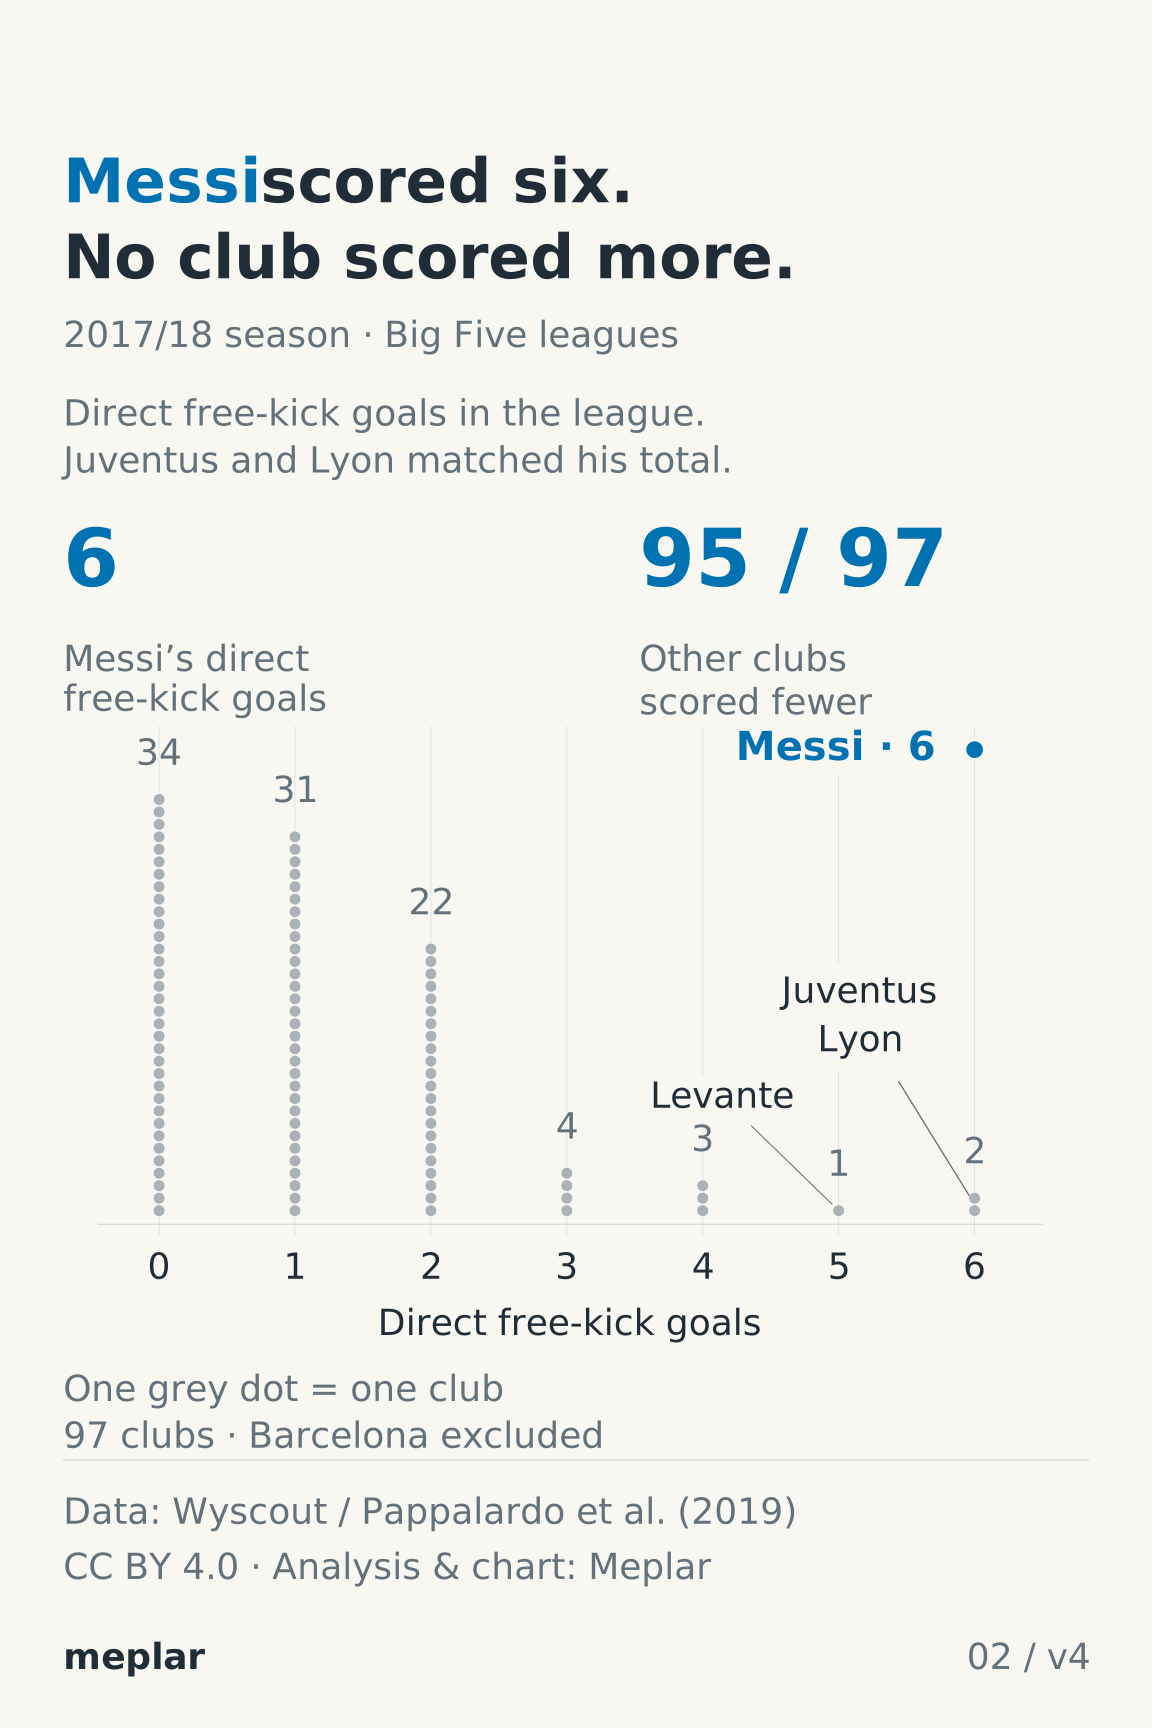
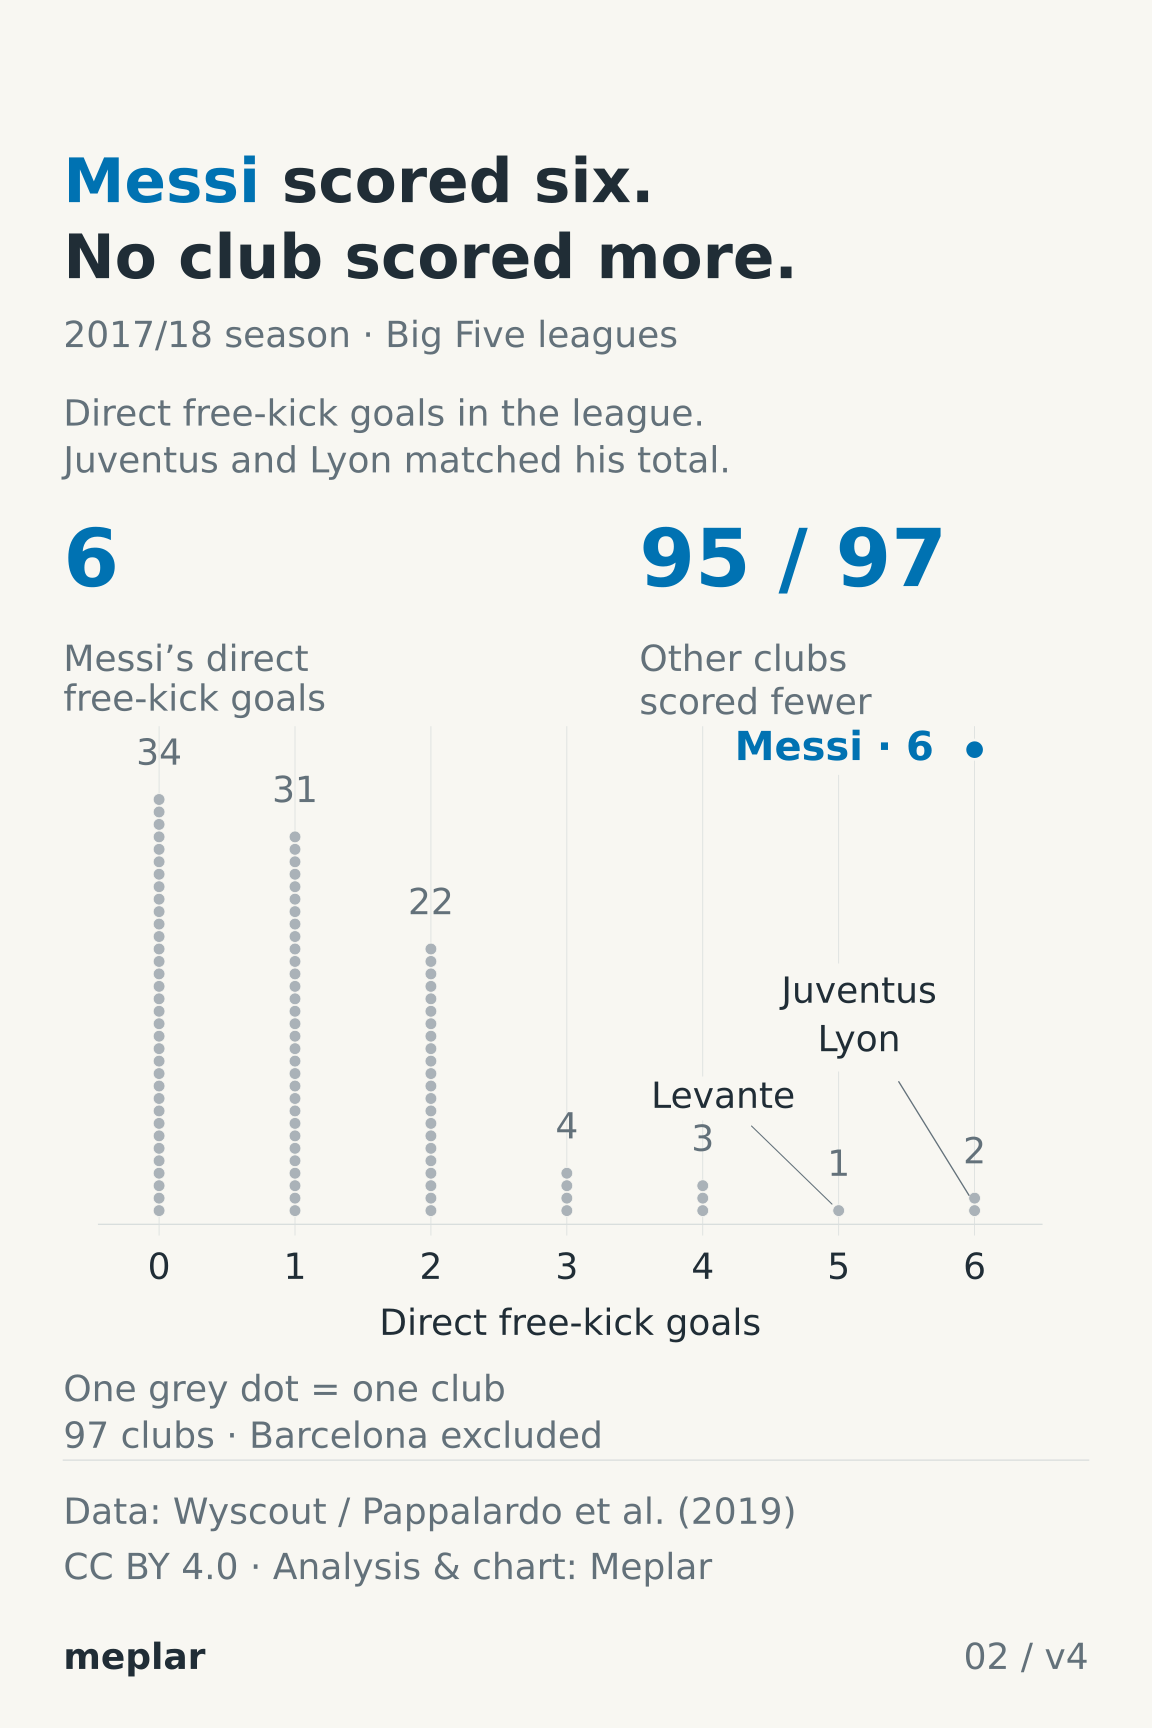
plotted_data/02_all_97_clubs_plus_messi.csv has 97 club comparators and one separate Messi reference. Barcelona is excluded from the club rows because Messi scored all six of its qualifying goals. Of the 97 other clubs, 95 scored fewer than six; Juventus and Lyon each scored six. This compares goal totals, not conversion rates.
- entity_type / entity_name
- Distinguish a club comparator from the separate player reference. Messi’s highlighted point is not another club.
- country / team_id / player_id
- League label and provider identifiers. Interpret identifiers according to entity_type; blank identifiers are not zero.
- direct_free_kick_goals / direct_free_kick_shots
- Qualifying direct attempts use subtype 33 and directness tag 1101; goals also require tag 101. Omitting directness would include some indirect routines. Attempt counts are retained, but the chart ranks goal totals.
- plot_x_goals / plot_y_stack_position
- Horizontal position is the goal total. Club stack position within a goal-total group is arbitrary; vertical height counts clubs. The separate Messi reference uses an arbitrary display height.
3. Ronaldo’s shot locations
2017/18 season · La Liga
View chart and original exports
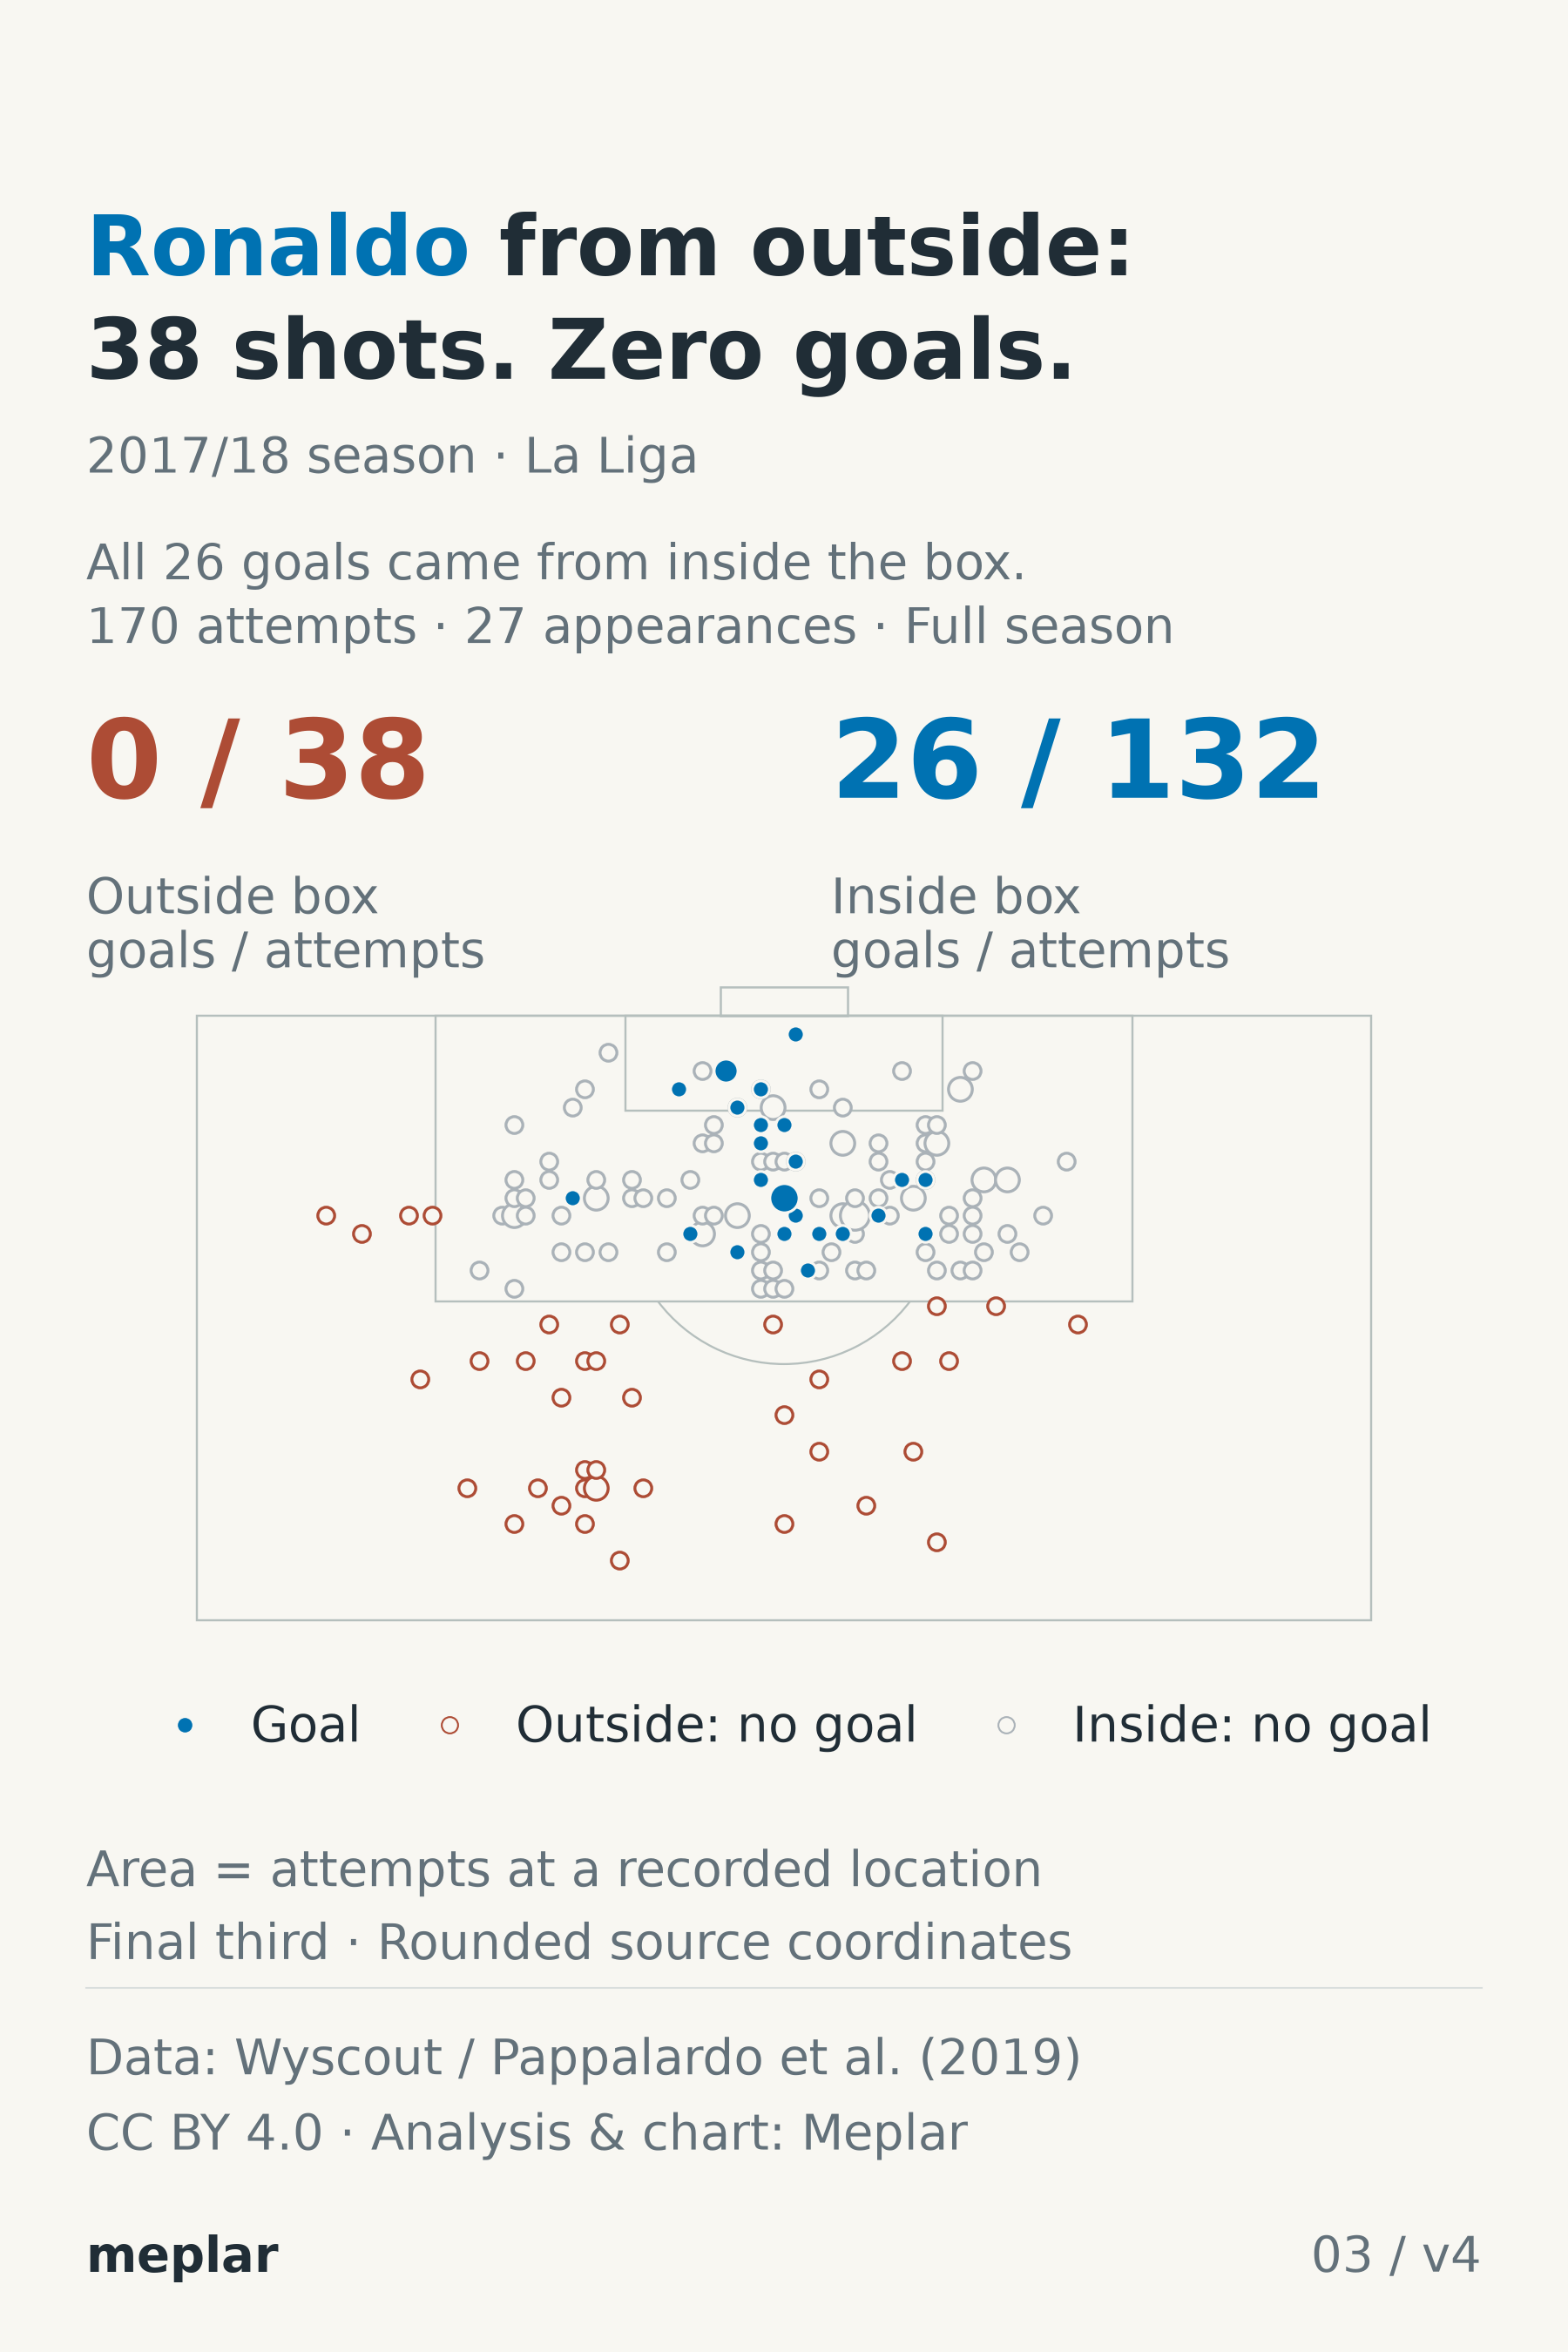
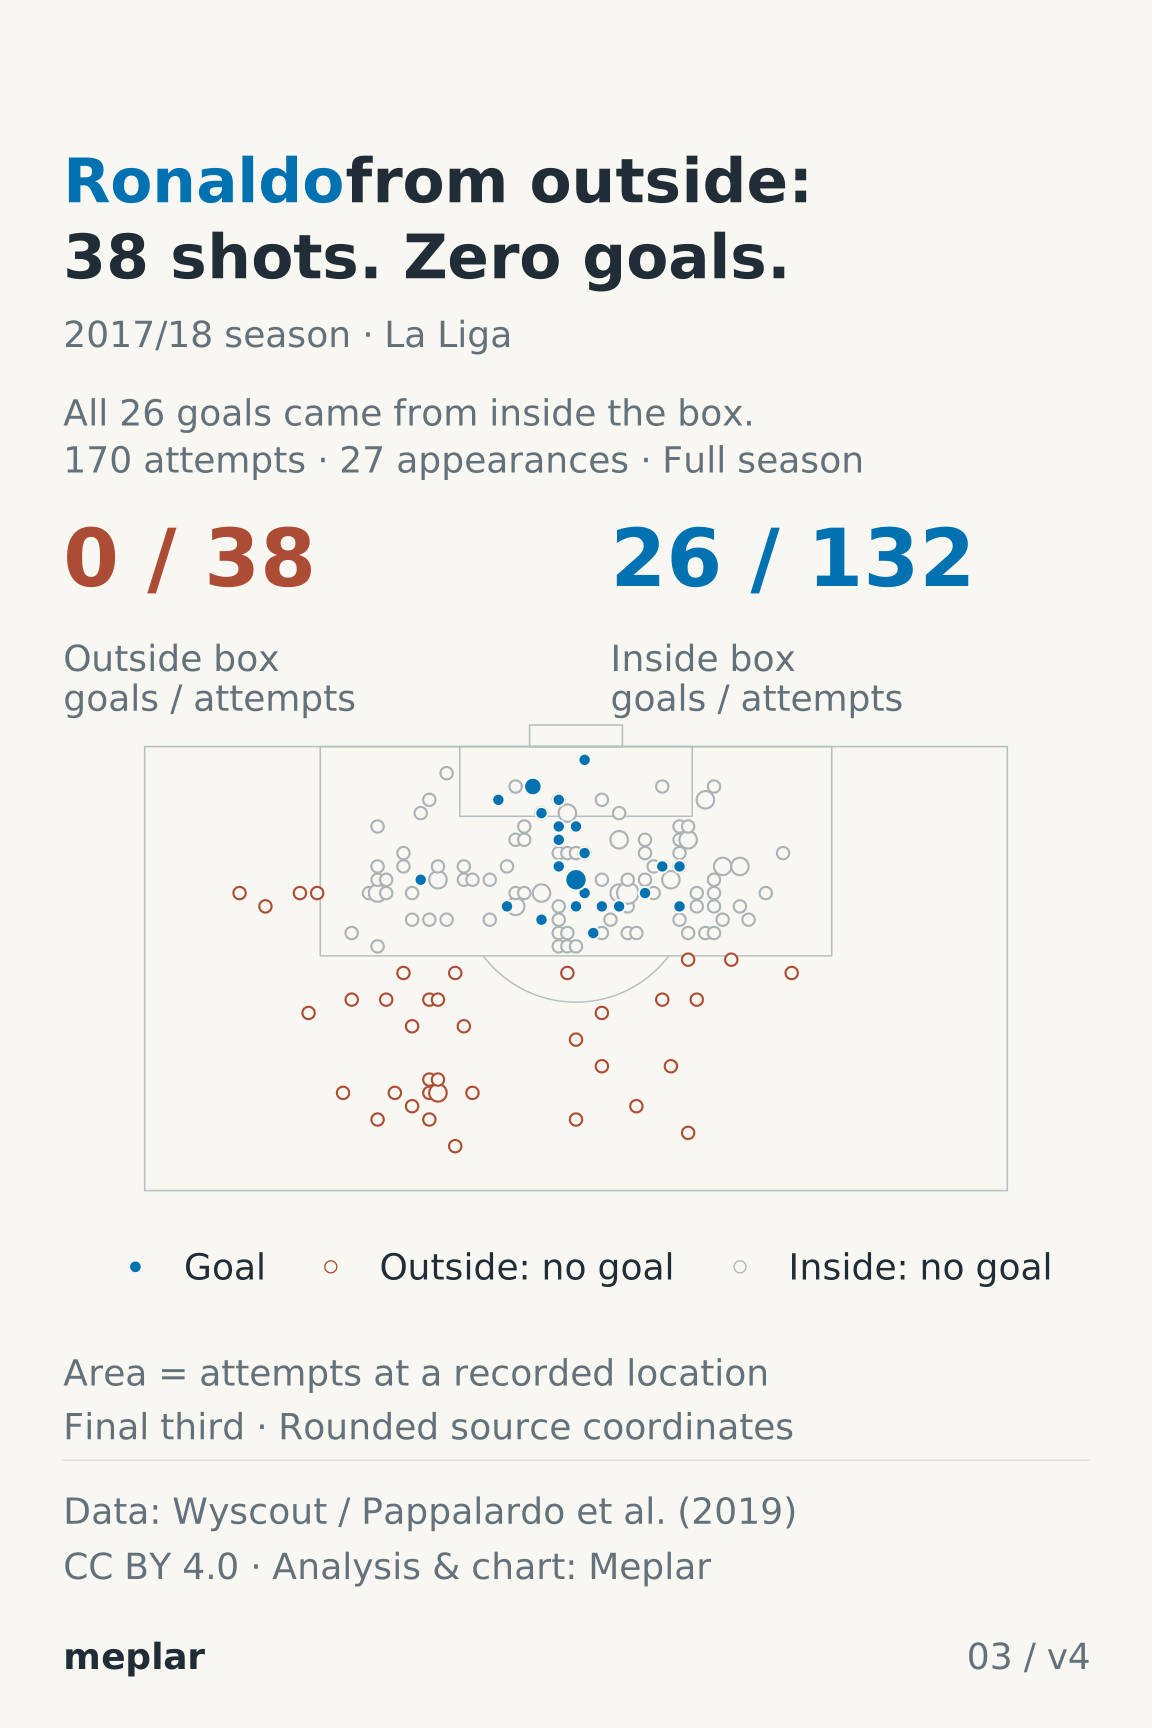
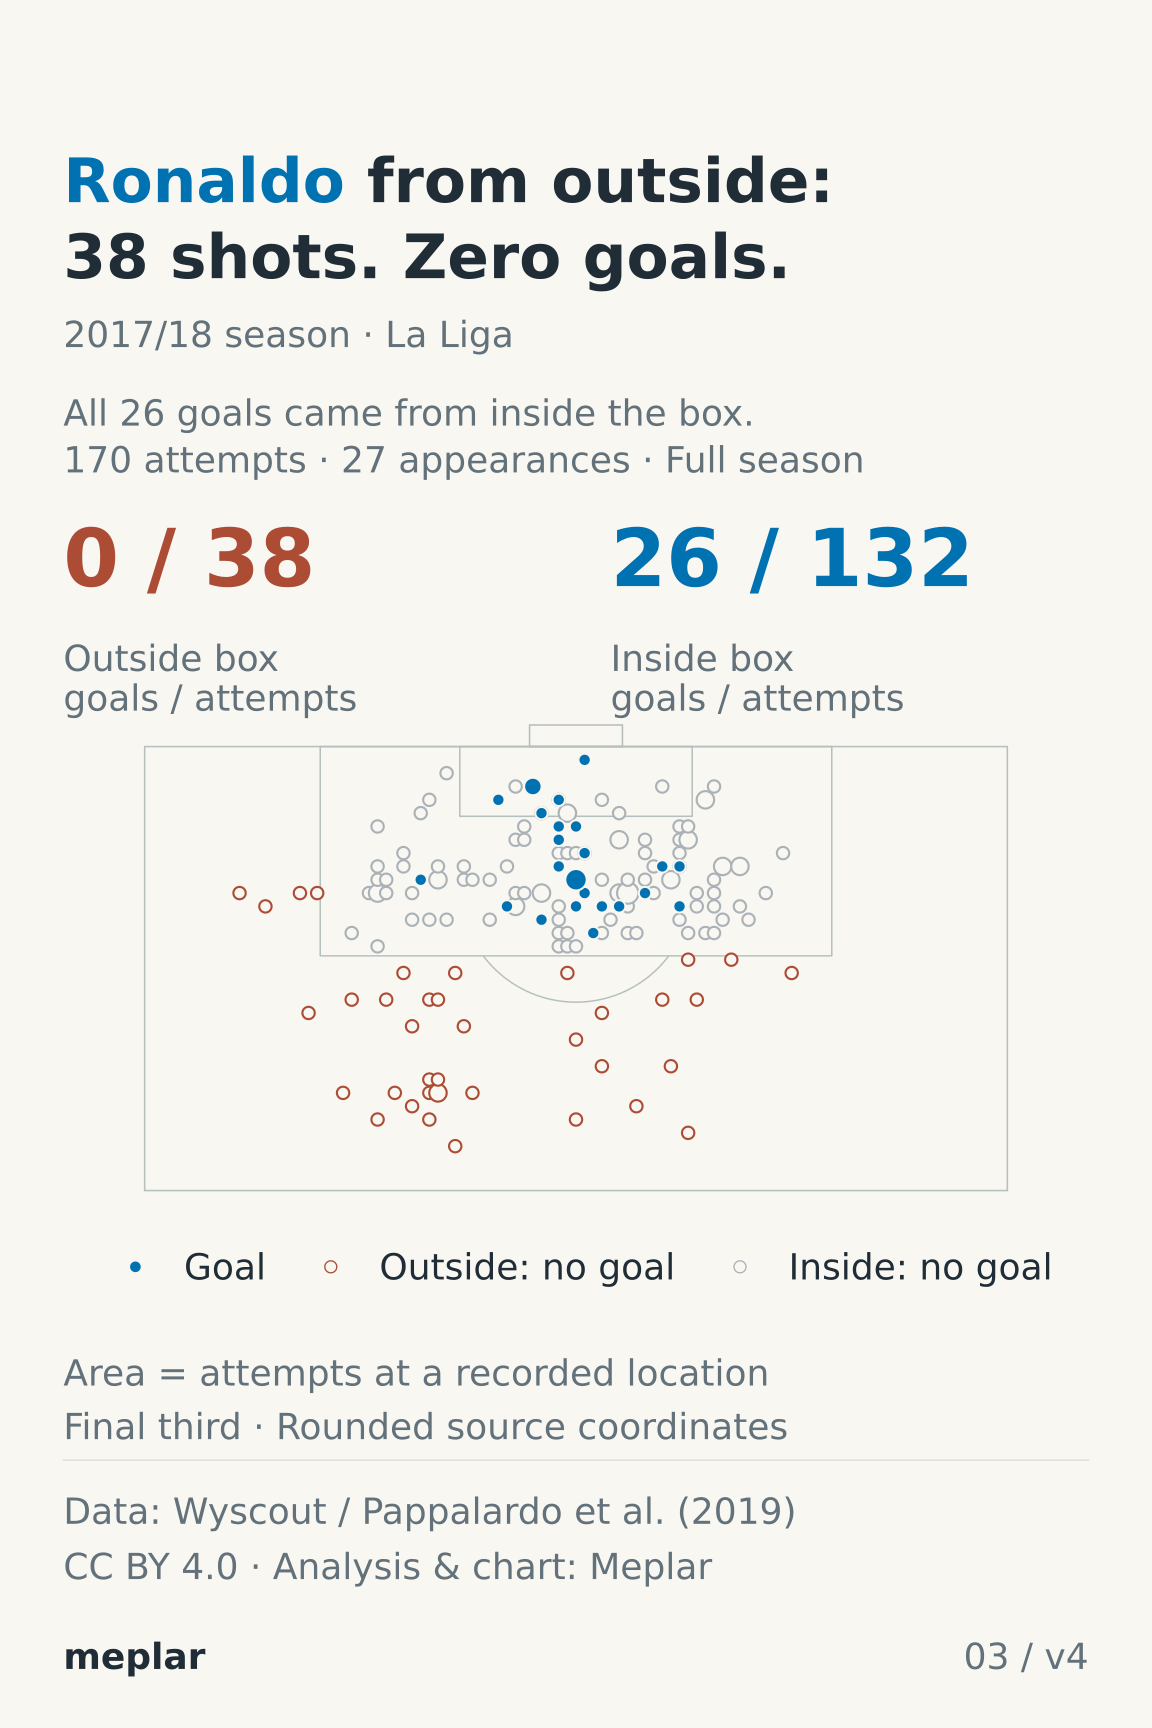
plotted_data/03_all_shot_location_groups.csv contains 152 exact coordinate-and-class groups representing 170 attempts. Outside the box are 38 attempts and no goals; inside are 132 attempts and 26 goals. The 15 direct-free-kick attempts are included once among the 38 outside attempts. Penalties remain in the full-season map; shoot-outs are excluded.
- x_pct / y_pct
- Provider-relative source position on a 0–100 coordinate scale, not geographic latitude/longitude or precise player tracking.
- plot_x_m
- Horizontal pitch-display position: y_pct × 0.68 on a 68 m reference-pitch width.
- plot_distance_from_goal_m
- Distance from the attacking goal line: 105 − x_pct × 1.05 on a 105 m reference pitch. All retained attempts are within 31.5 m; the chart displays the final 35 m at equal geometric scale.
- goal / outside_box
- 0/1 outcome and box-class flags. Goal uses tag 101. Inside means source x ≥84.2857142857 and y from 20.3529411765 through 79.6470588235, including the boundaries. Borderline membership depends on rounded source positions and the reference-pitch assumption.
- marker_attempt_count / event_ids
- Number of attempts sharing the marker and their semicolon-separated event IDs. Marker area is proportional to this count. Twenty-three blue location/class marks represent 26 goals; every shot ID occurs in exactly one group.
4. Ronaldo’s scheduled matchweek halves
2017/18 season · La Liga
View chart and original exports
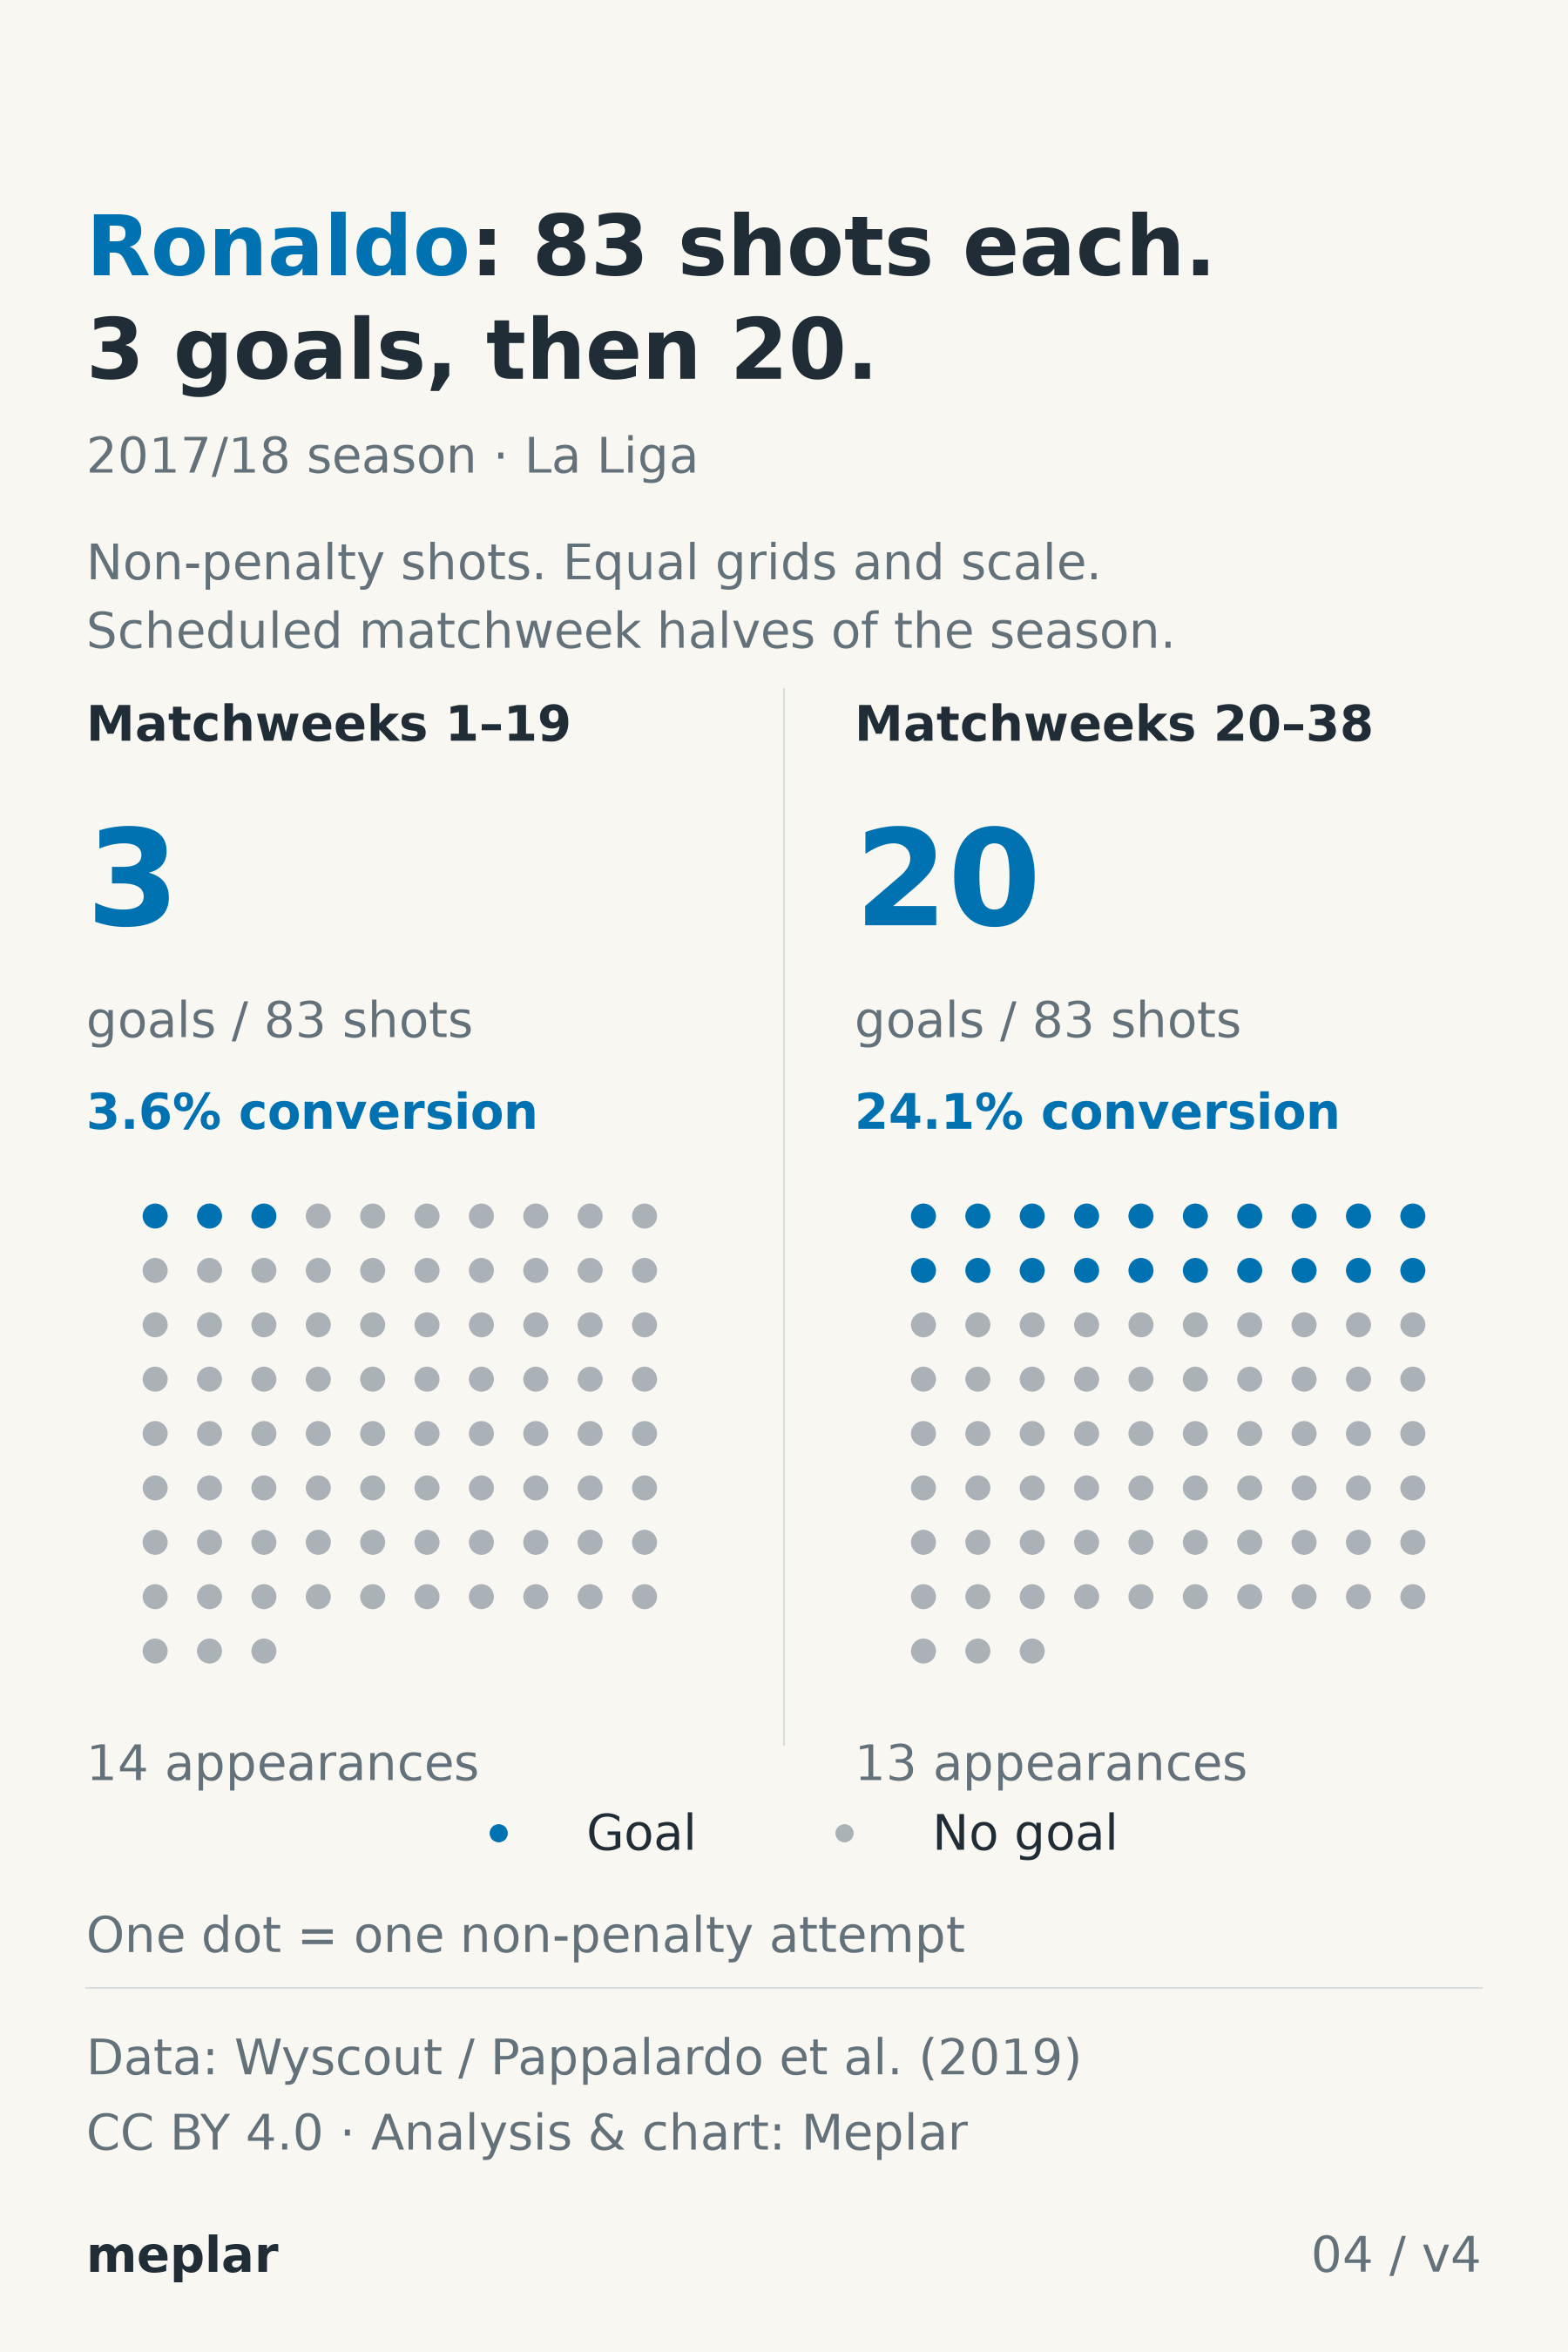
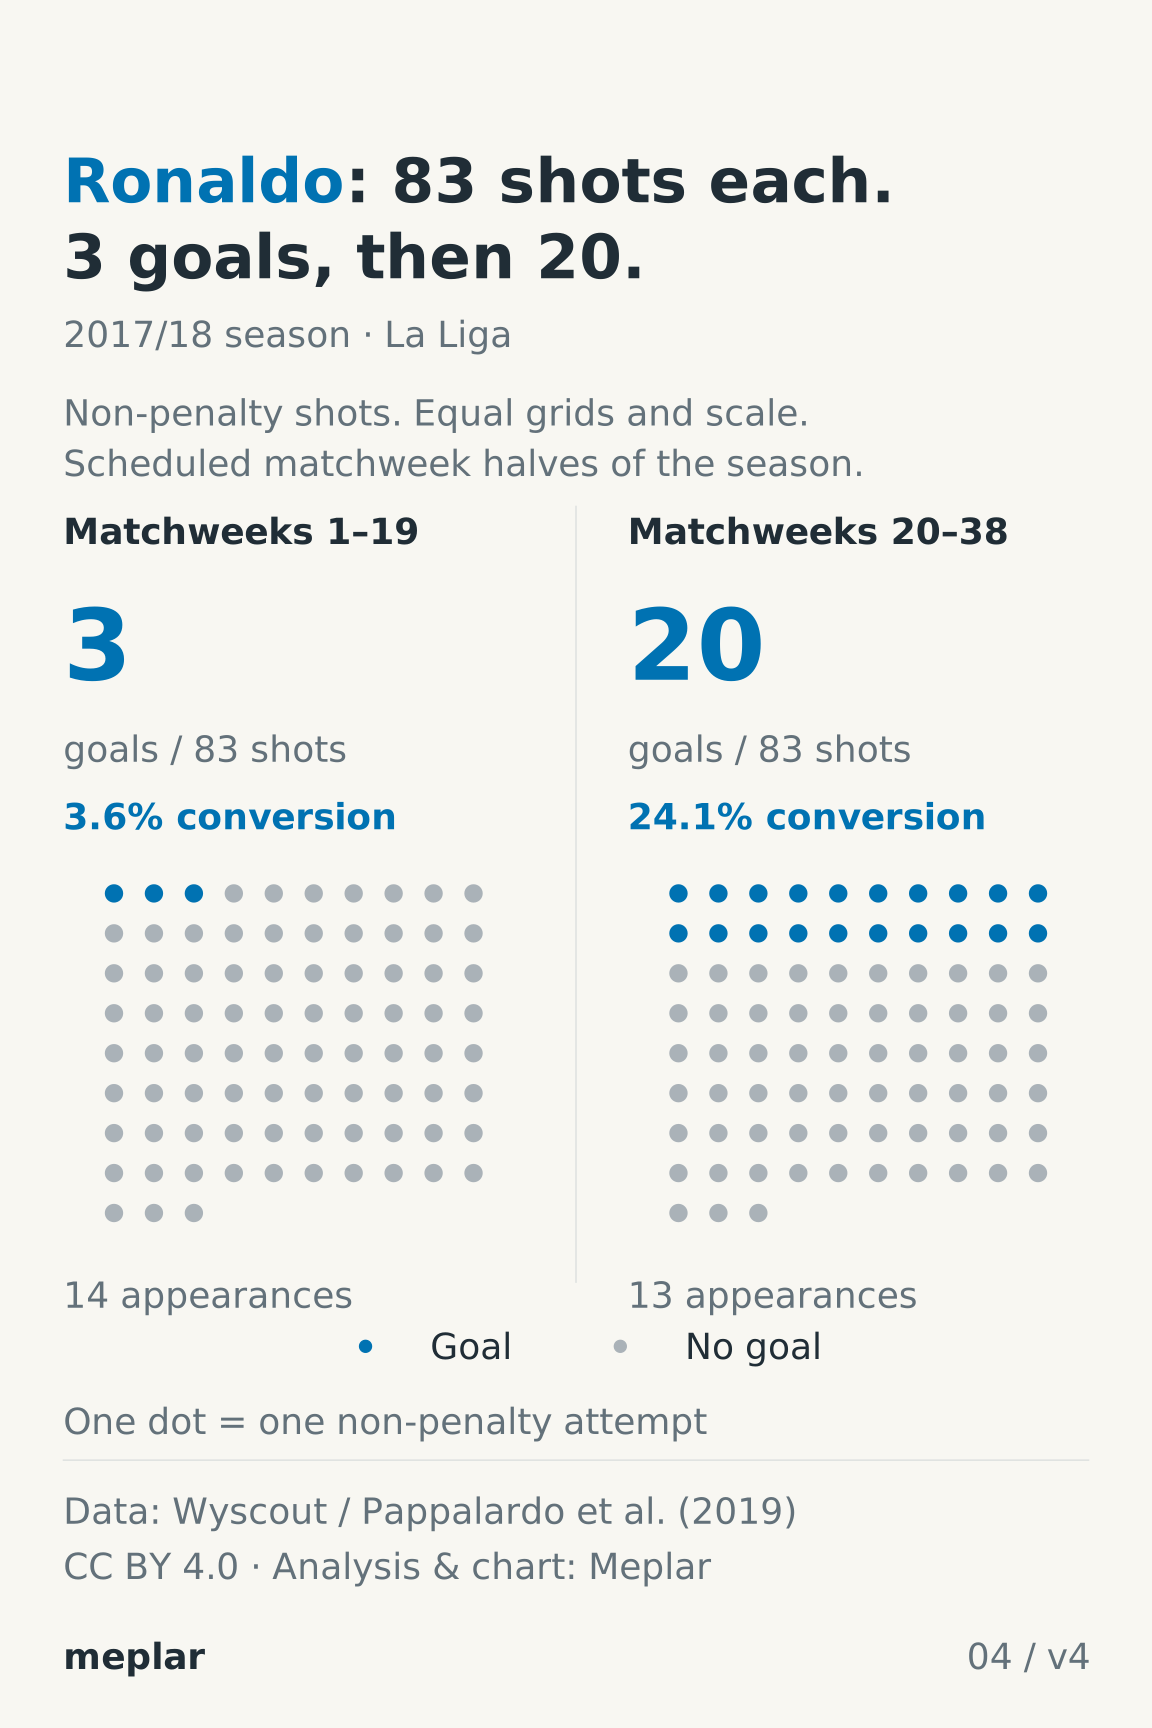
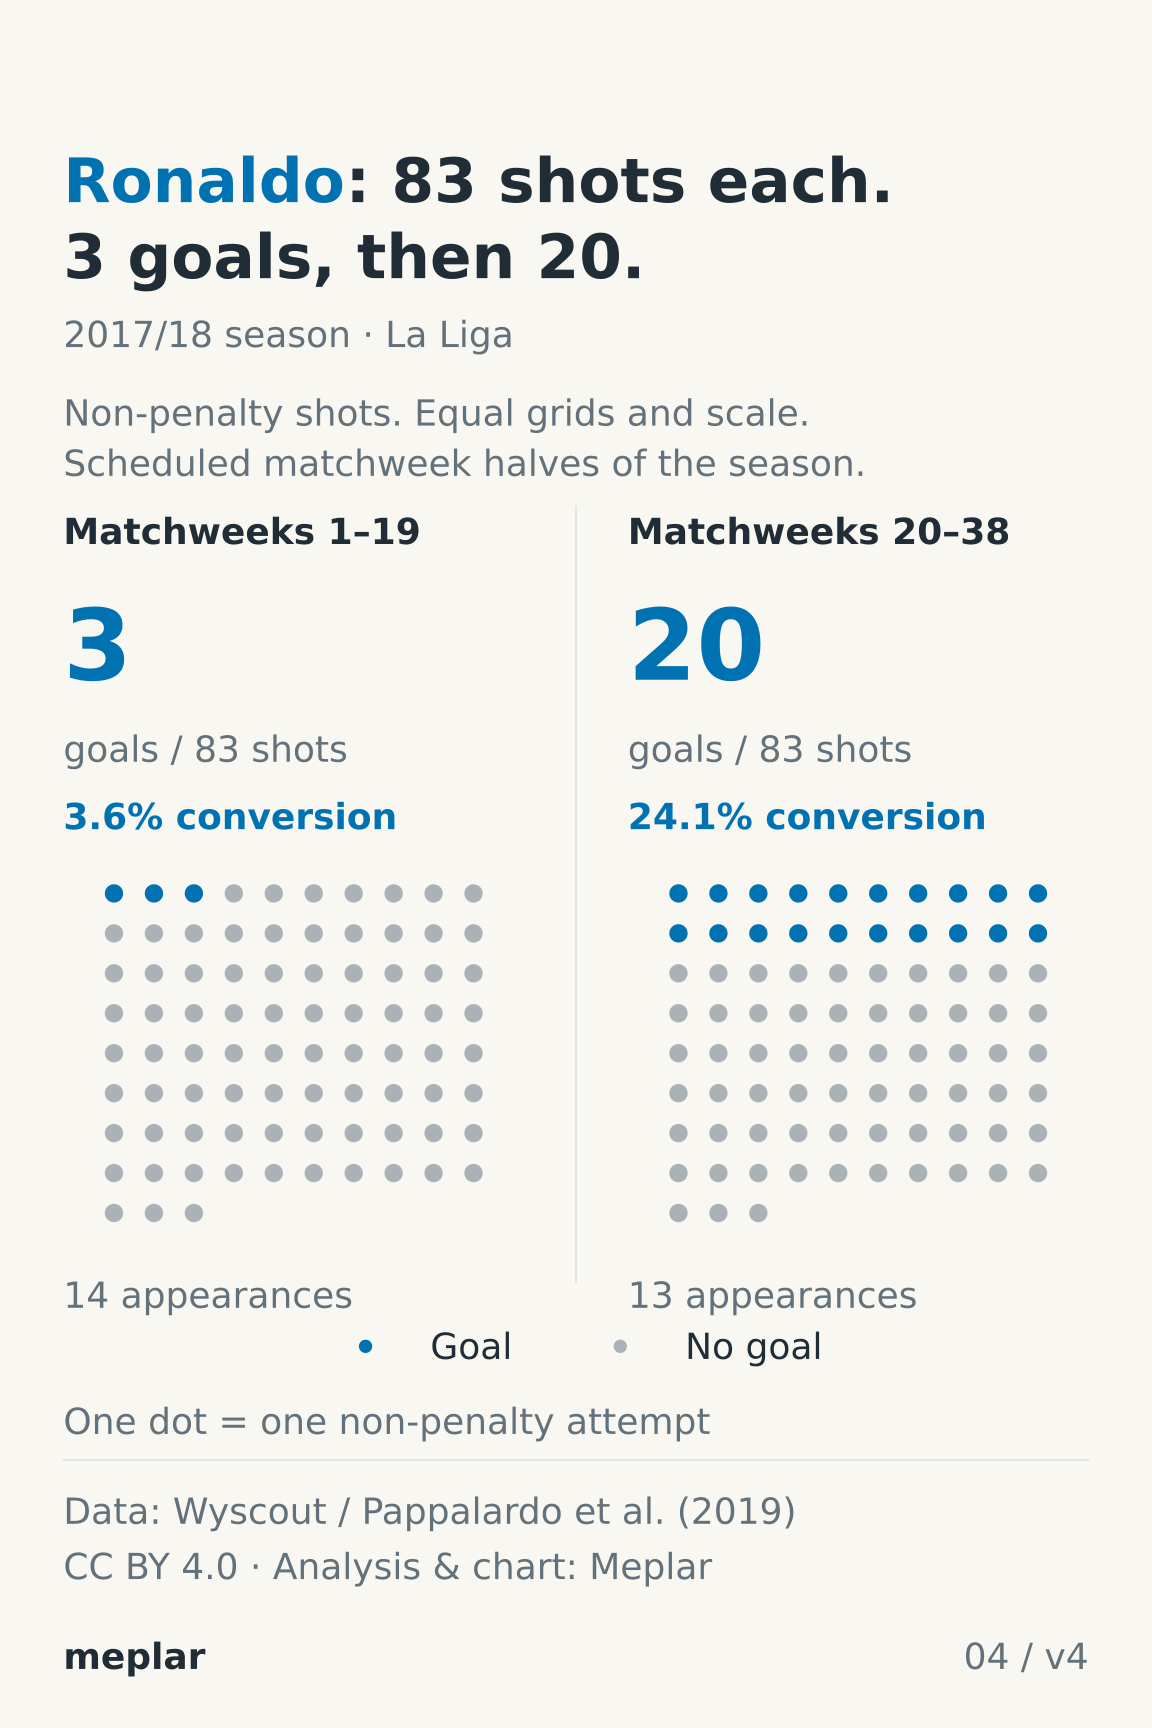
plotted_data/04_all_166_nonpenalty_attempt_dots.csv gives one schematic dot per non-penalty attempt: 83 in matchweeks 1–19 and 83 in matchweeks 20–38. These are scheduled league halves; postponed matches retain their scheduled matchweek. They are not chronological halves, calendar-year bins or equal appearance counts: the periods contain 14 and 13 appearances.
- half_season
- 1 means scheduled matchweeks 1–19; 2 means 20–38.
- dot_index
- One-based display index 1–83 separately within each half. Goal-first ordering is for counting, not event chronology, and this field is not an event-ID join.
- plot_column / plot_row
- Zero-based schematic grid coordinates: for j = dot_index − 1, column = j modulo 10 and row = floor(j ÷ 10). The two panels use identical grids and marker rules.
- goal
- 1 for a goal dot and 0 for another non-penalty attempt. Blue means goal and grey means non-goal in both periods.
Reproduce non-penalty conversion: 3 ÷ 83 × 100 ≈ 3.6145%, displayed as 3.6%; 20 ÷ 83 × 100 ≈ 24.0964%, displayed as 24.1%. Both periods deserve equal prominence. Including penalties, each half has 85 attempts, producing 4 and 22 goals; together they reconcile to the map’s 170 attempts and 26 goals.