What the chart shows
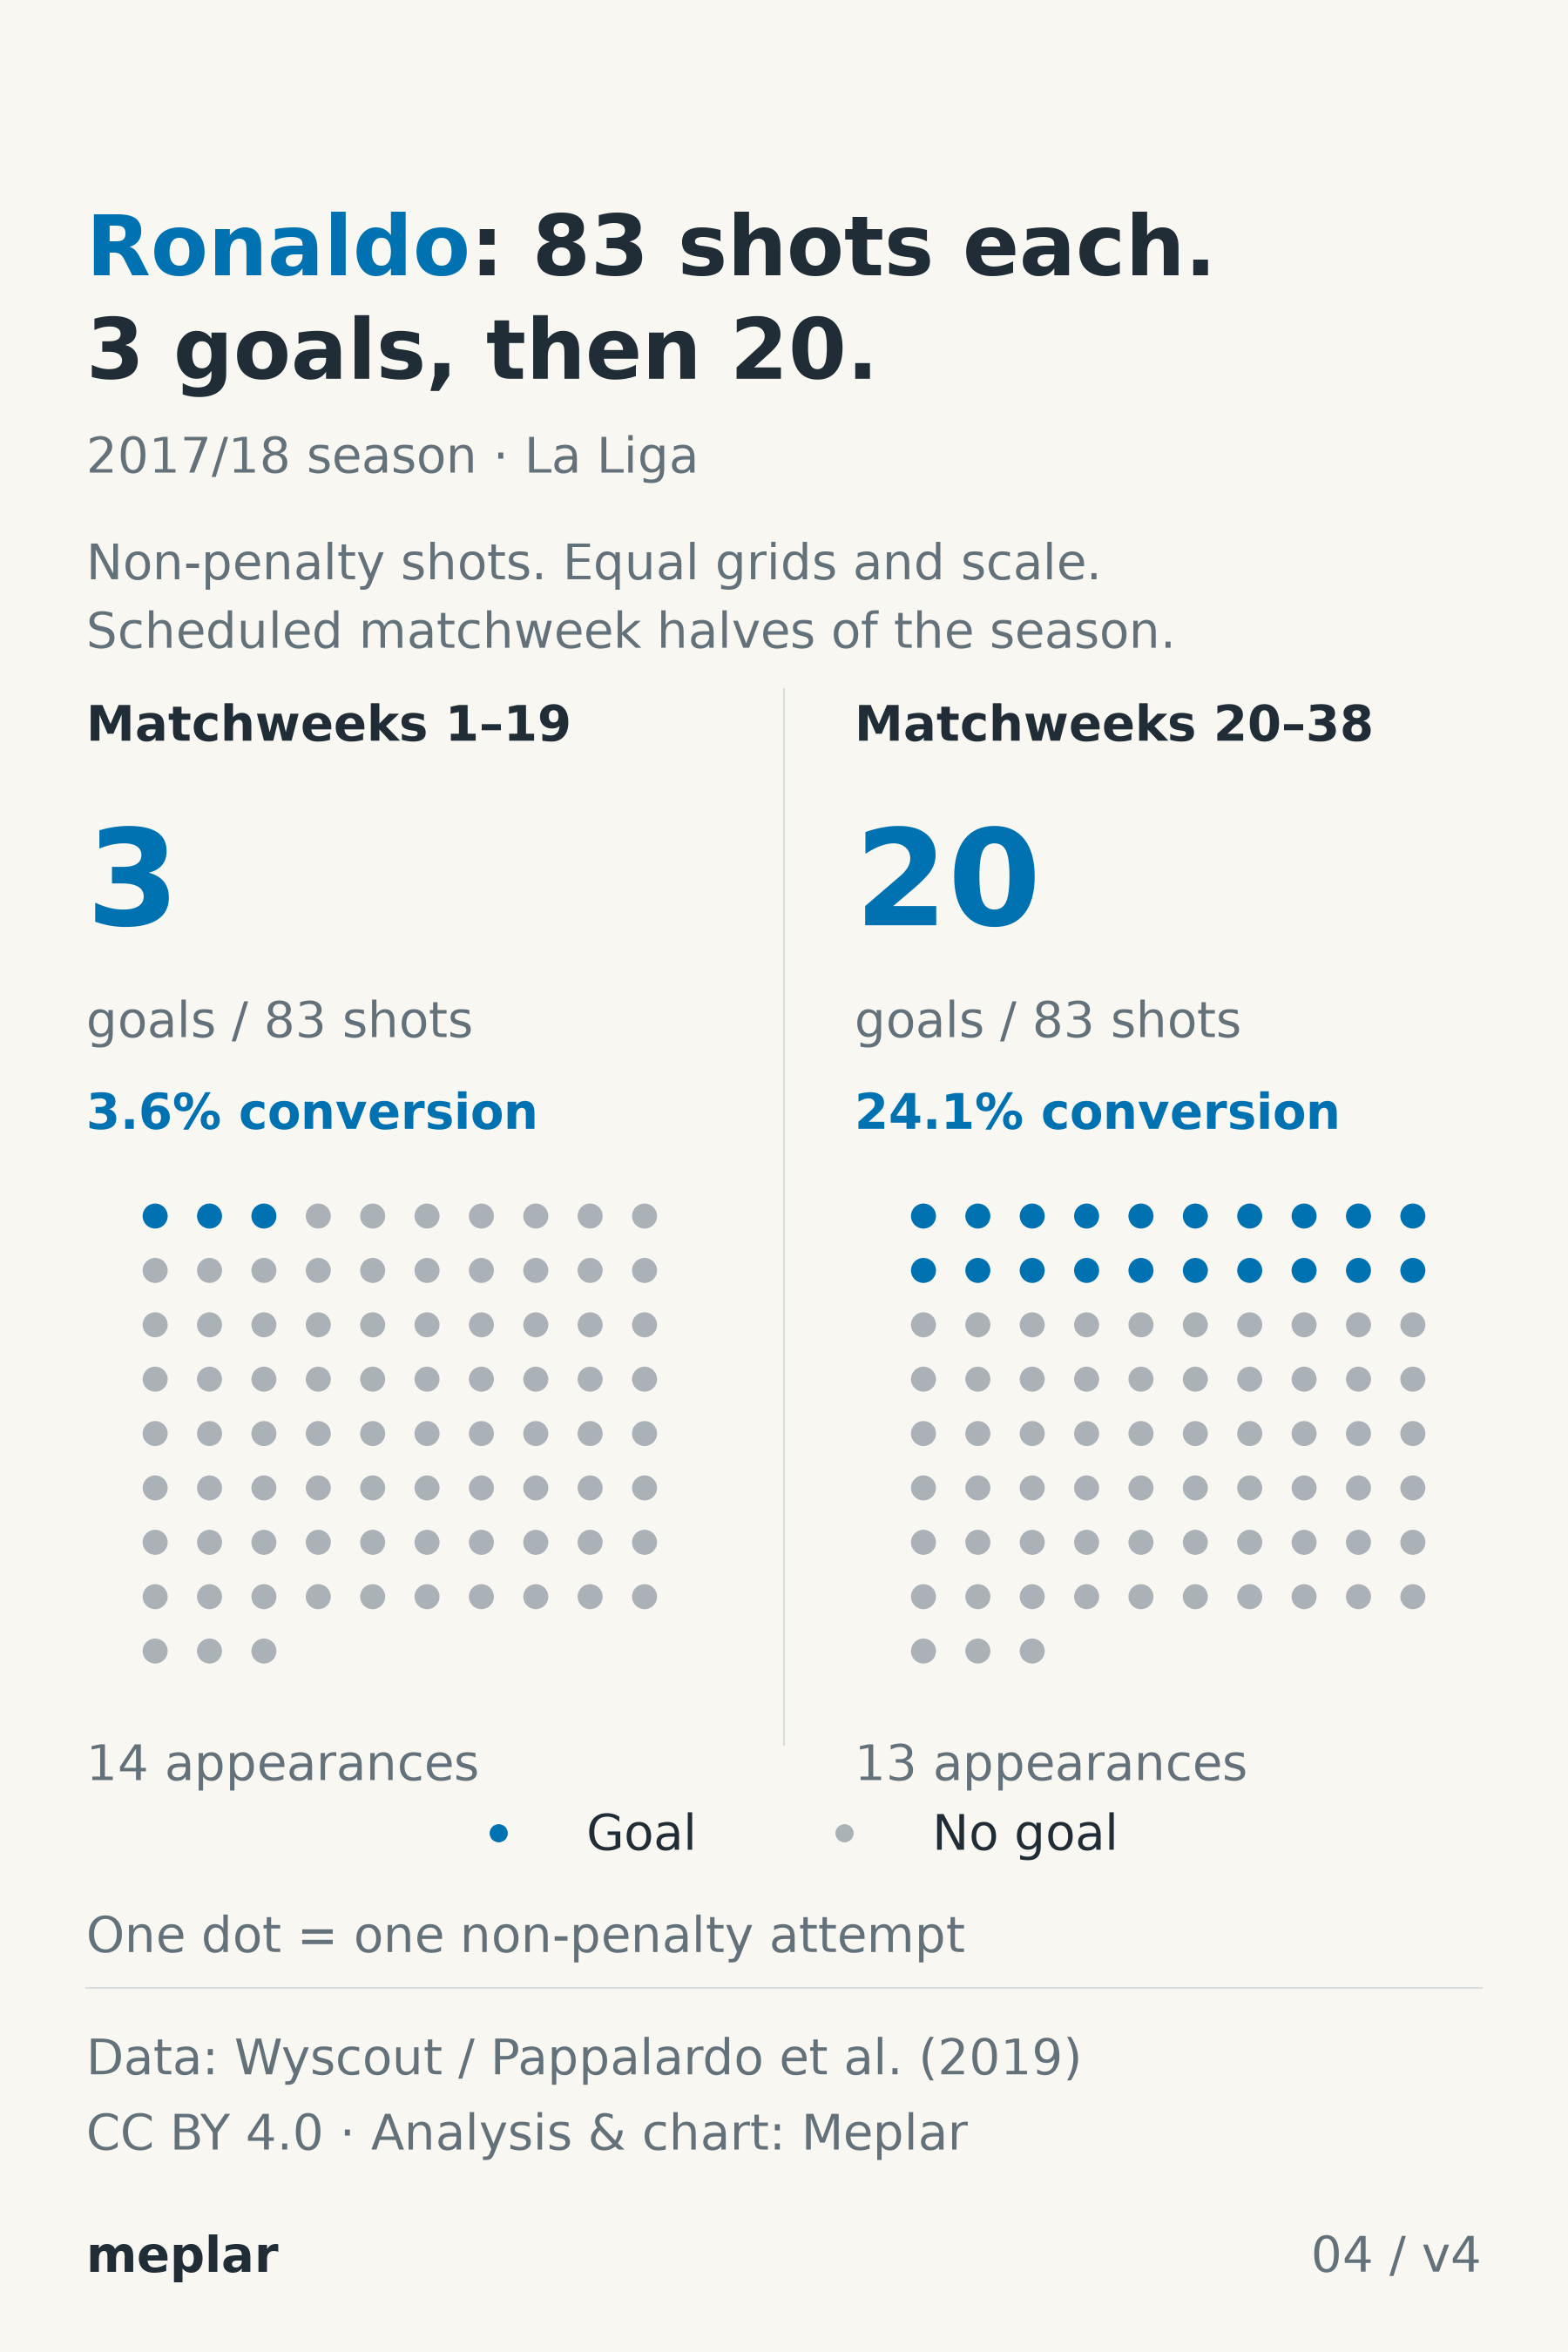
Equal attempt counts make the arithmetic transparent: 3 / 83 × 100 = 3.6%, while 20 / 83 × 100 = 24.1%, rounded once to one decimal. The difference is 20.5 percentage points, or 17 additional goals from the same number of non-penalty attempts. It is a contrast between two observed periods, with no claim that the underlying chances were equivalent.
The full non-penalty season totals 23 goals from 166 attempts, or 13.9%. Including the four penalty attempts and three penalty goals gives the separate complete-map totals of 170 shots and 26 goals. Showing both halves with equal space keeps the later recovery alongside the low first-half return.
Cristiano Ronaldo for Real Madrid, men’s LaLiga 2017/18. Scheduled matchweeks 1–19 and 20–38; 83 non-penalty attempts in each period, across 14 and 13 appearances respectively.
How it was made
Split the LaLiga schedule at its natural midpoint: scheduled matchweeks 1–19 and 20–38. Use scheduled matchweek even when a fixture was played later. These are not chronological halves, calendar-year bins, a rolling window or equal-appearance groups.
Exclude the four penalty attempts and three penalty goals, then sum the remaining event rows within each scheduled half. Reconcile them to all 27 appearance rows: 14 appearances in the first period and 13 in the second. Each period has 83 non-penalty shots; their goal counts are three and 20.
Draw one dot per non-penalty attempt on identical grids, with the same goal/non-goal colors and marker size. The first panel has three goal dots and 80 others; the second has 20 and 63. Dot order is schematic for counting and does not reconstruct the timing or order of individual attempts.
Definitions & limits
- This covers Ronaldo’s LaLiga 2017/18 events only. Cups, European competition and national-team matches are excluded.
- The halves contain 14 and 13 appearances, not equal playing time. No minutes, opposition, role or chance-quality adjustment is made.
- The dot chart excludes penalties. Each all-shot half instead contains 85 attempts, returning four and 22 goals; the full season map retains all 170 attempts and 26 goals.
- Percentages use non-penalty attempts as the denominator and are descriptive conversion rates. No expected-goals model or causal explanation for the change is supplied.
- Neither period establishes current form, permanent ability, selfish intent or the value of an unobserved alternative pass. Both periods are required to describe this season.
Original sources & reuse
- Wyscout / Pappalardo & Massucco (2019), Events, fixed version 1
- Pappalardo et al. (2019), public soccer match-event data paper
- Pappalardo et al. (2019), PlayeRank, requested collection citation
- Underlying data licence: Creative Commons Attribution 4.0 International
- Wyscout shot definition
Data: Wyscout / Pappalardo & Massucco (2019), Figshare, CC BY 4.0. Data paper: Pappalardo et al. (2019).
Meplar assigned event rows to scheduled matchweek halves, excluded penalty attempts and goals from these grids, reconciled the event/match/period totals, calculated goals divided by attempts, and visualized every included non-penalty attempt on two identical schematic grids. No source endorsement is implied.
This analysis uses the fixed Events version 1 release. A source retrieval date is not documented for this page. The checks reconcile supplied derivative tables and selected event audits; they do not constitute a new audit of the full raw event archive.