India · chart insight
Where ₹100 goes.
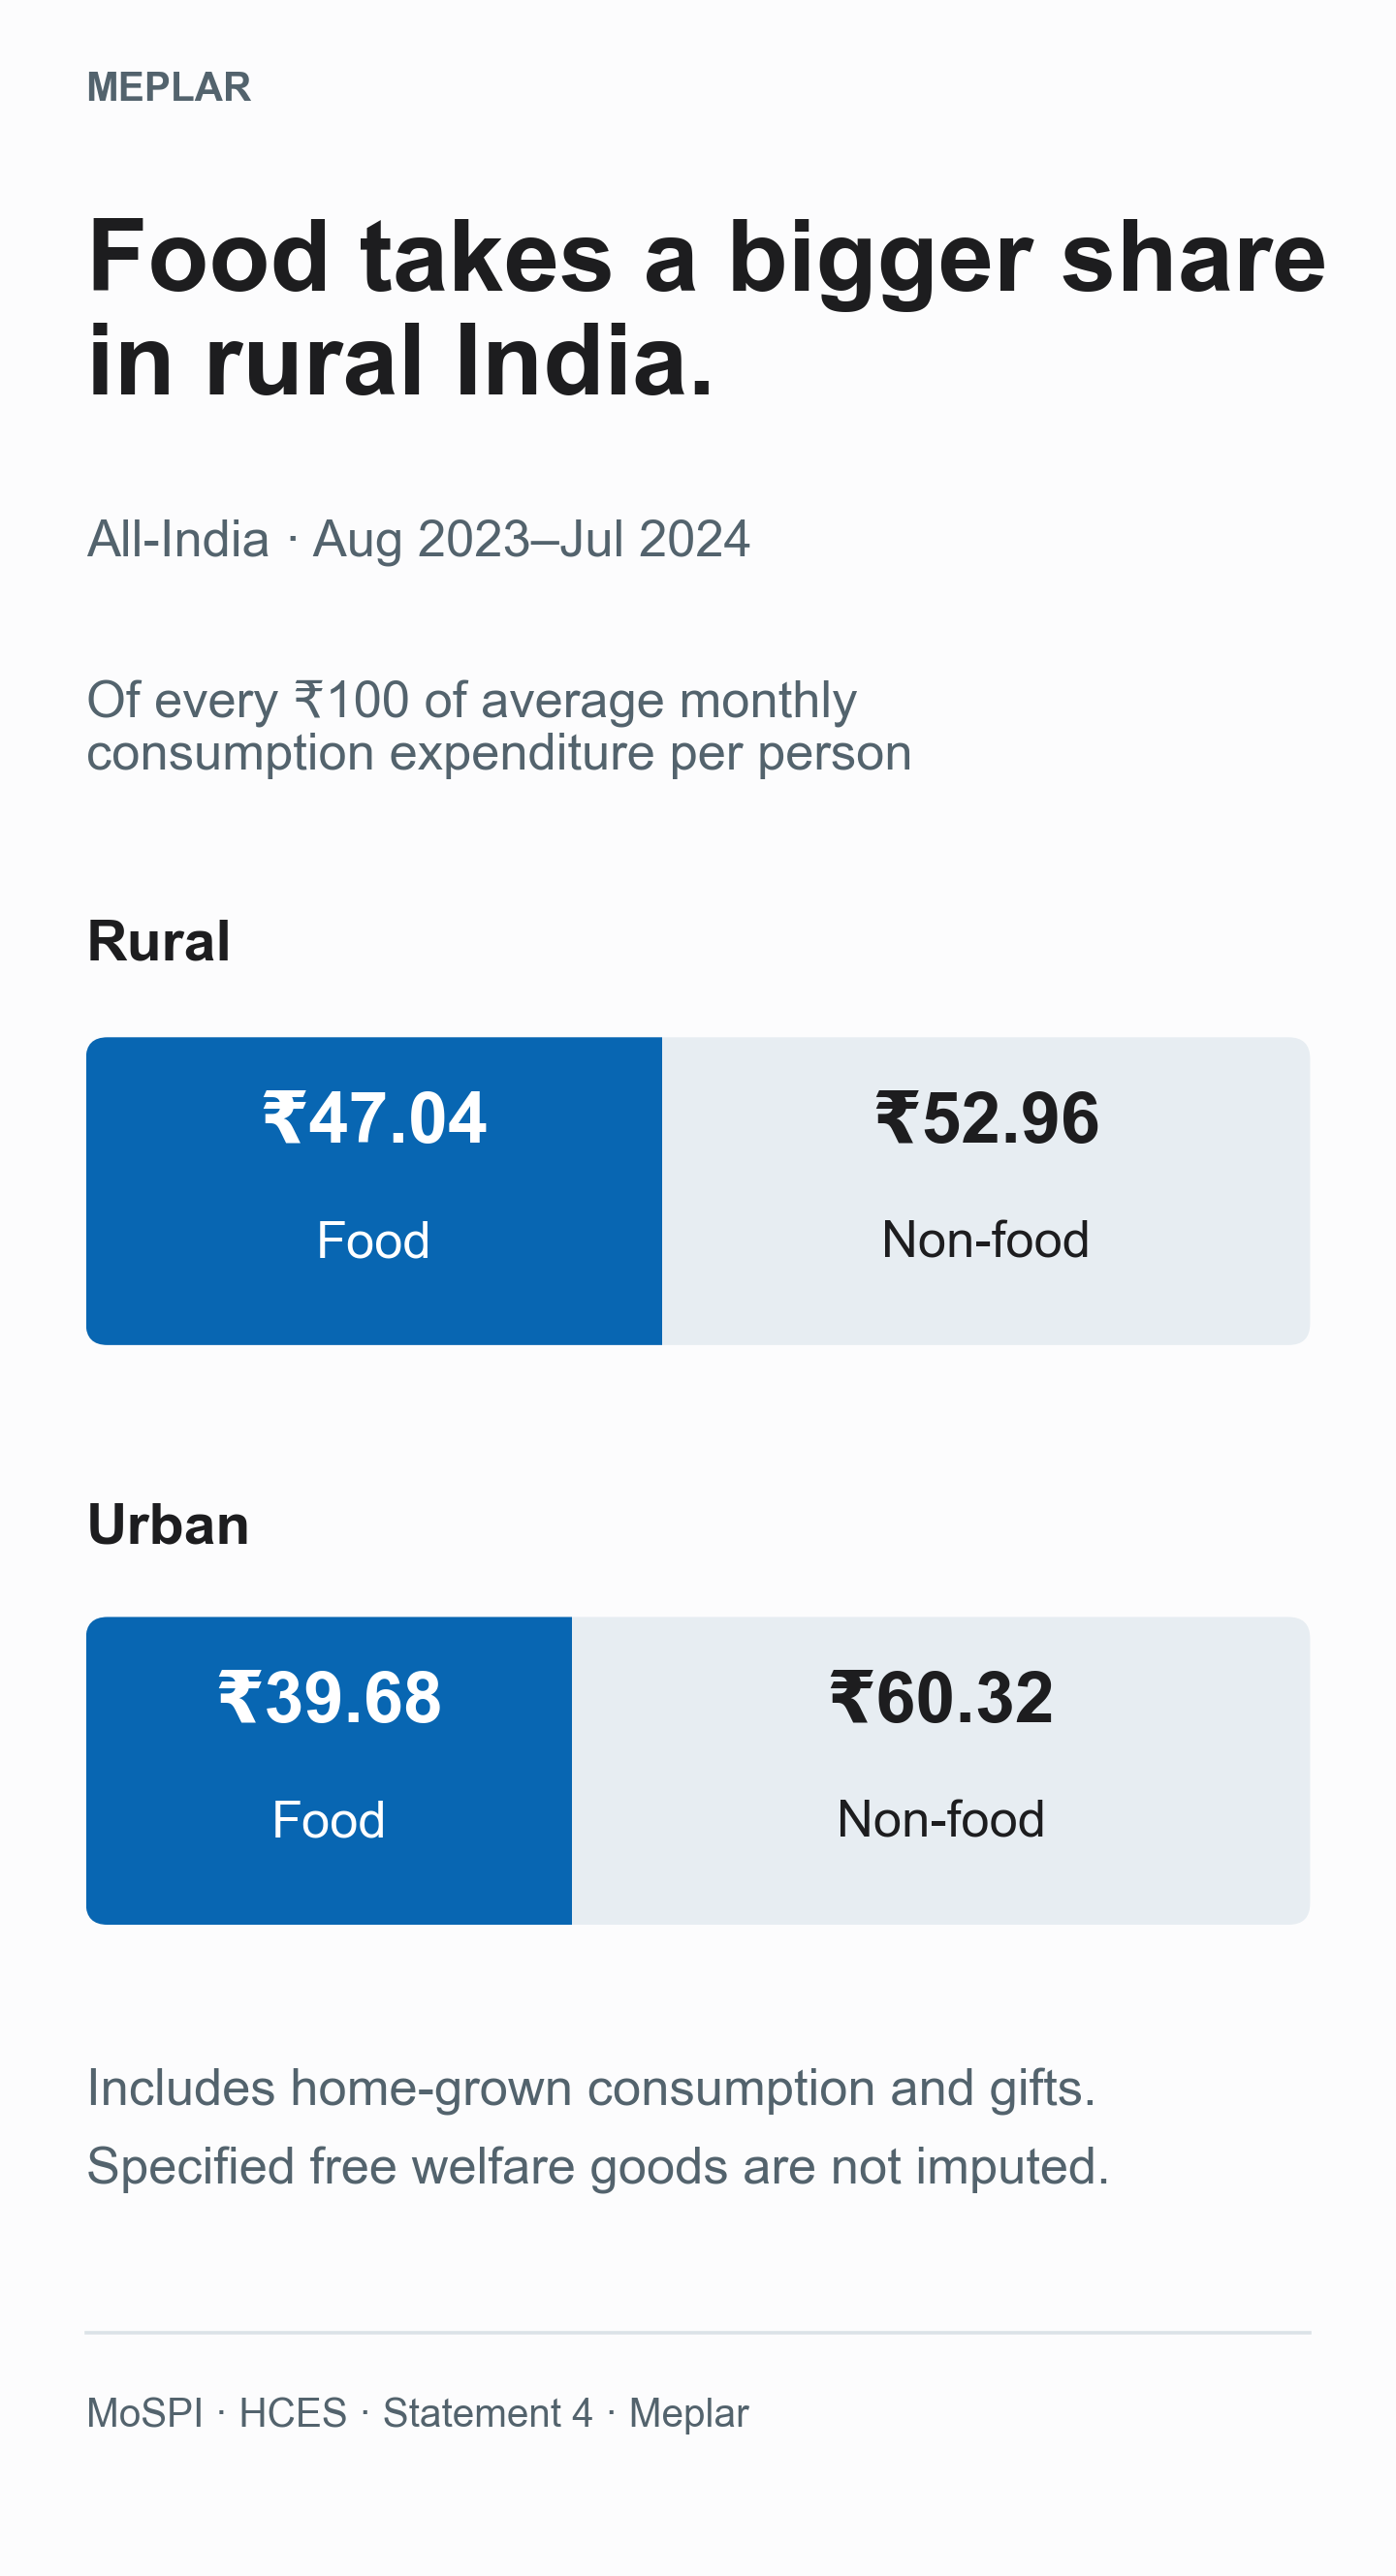
Of every ₹100 of average monthly consumption expenditure per person, food accounts for ₹47.04 in rural India and ₹39.68 in urban India.
 Explore the insight
Source: MoSPI / NSO · HCES 2023–24 Fact Sheet, Statement 4 · Source & reuse notes
In context. Shares of average monthly consumption per person, not income. Home-grown consumption and gifts are included; the additional valuation of specified free welfare goods is excluded.
The rural food share is 7.36 percentage points higher. Yet average food consumption expenditure is higher in urban India: ₹2,776 per person per month, versus ₹1,939 in rural India. The corresponding total MPCE averages are ₹6,996 and ₹4,122. A smaller percentage can therefore accompany a larger rupee amount.
These are published rural and urban averages, rather than the same households followed over time. The measure includes valued home-grown consumption and gifts, so it is broader than money paid out. Section I leaves out the additional valuation of specified free welfare goods; it does not remove every kind of imputation.
Two food groups, in context
| Item group | Rural | Urban |
|---|---|---|
| Beverages, refreshments, processed food Includes purchased cooked meals. | 9.84% | 11.09% |
| Cereals & cereal substitutes | 4.99% | 3.76% |
These groups are already included in the food segment. Their percentages use total MPCE as the denominator; they are not additional slices or percentages within food.
Files & formats
- chart_data.csv — Four plotted sector/category rows, with published shares and their MPCE denominators.
- statement4.csv — All 24 Statement 4 rows, including explicitly marked subtotals.
- chart.png — Reviewed original chart, 1440 × 2658 pixels.
- chart.svg — Self-contained outlined vector chart; no external font dependency.
- README.md — Interpretation, scope, fields, source provenance and offline instructions.
- SOURCE_TERMS.txt — Verified MoSPI source-reuse permission and conditions.
- SOURCE_PROVENANCE.json — Official source locations, hashes, selection and reuse evidence.
- table-extraction-notes.json — Exact table extraction and rounding checks.
- source-reuse-record.json — Compact verified Category A reuse record; no unrelated website bundle.
- reproduction.zip — Standalone offline build with frozen CSV, original factsheet PDF, code and source notes.
- SHA256SUMS.txt — SHA-256 hashes of all other public files in this directory.
Method & scope
How it was made
Transcribe all 24 Statement 4 rows from the official HCES 2023–24 Fact Sheet and check every label and all 96 numeric cells against both PDF text and the rendered table. Preserve the published whole-rupee MPCE amounts and two-decimal share strings. Select only food total and non-food total for each sector; express each published percentage as rupees per ₹100 of total average monthly per-capita consumption expenditure. The two segments sum to ₹100 in each sector. Do not add subtotals to their component rows or recompute shares from the displayed rupee amounts.
Definitions & limits
- MPCE means average Monthly Per Capita Consumption Expenditure. It is not income, median expenditure, a household total or the budget of a typical family.
- The survey period is August 2023 through July 2024, not an April–March fiscal year. Values are nominal Indian rupees; no inflation adjustment is added.
- Section I excludes the additional imputed values of specified goods received free through social welfare programmes. It retains valuation of home-grown/home-produced consumption, gifts, loans, free collection and goods received in exchange. Do not describe this as no imputation or cash-only spending.
- A smaller urban food share accompanies a higher urban rupee amount: ₹2,776 per person per month versus ₹1,939 in rural India. The total MPCE denominators are ₹6,996 and ₹4,122 respectively.
- The supporting food-group figures are shares of total MPCE and are already included in the food segment. The broad beverages, refreshments, processed food group includes purchased cooked meals; it is not just packaged or ultra-processed food. Cereals include cereal substitutes; the pulses group includes gram.
- Different source items use different recall periods under the Modified Mixed Reference Period approach; the published results are expressed as monthly MPCE. The factsheet does not supply a full household-level estimator here, and Meplar does not invent one.
- All-India survey coverage excludes a few inaccessible villages in the Andaman and Nicobar Islands. These are published survey estimates, without uncertainty intervals shown in the graphic.
- This single-period rural/urban comparison does not establish a time trend or the causes of consumption differences. No affordability, health, income or urbanisation effect is estimated.
Original Meplar chart/design with AI assistance from ChatGPT/Codex. Tools: Python standard library, Decimal arithmetic, Matplotlib 3.9.4 and local Poppler. I run Meplar. No paid assets or services were used.
Fields & examples
sector / category | Rural or Urban; Food or Non-food. The chart CSV has four rows. |
|---|---|
share_pct | Published percentage of total sector average MPCE, retained at two decimals. |
rupees_per_100_average_mpce | Same numeric value as share_pct, expressed per a notional ₹100 of total average MPCE. |
category_mpce_rs / total_mpce_rs | Published whole-rupee monthly-per-person category amount and sector total. |
source_row / item_group | Original Statement 4 order and label, with wrapped lines joined and footnote markers retained. |
category_kind / broad_category | Component or subtotal classification; use to avoid counting subtotals twice. |
rural_mpce_rs / urban_mpce_rs | Source monthly-per-person nominal rupee amounts for each sector. |
rural_share_pct / urban_share_pct | Source share strings of total sector MPCE; do not recompute from displayed rupees. |
footnote_marker | * means pulses include gram; # means the combined beverages/refreshments/processed-food group includes purchased cooked meals. |
Example: the rural food row has share_pct=47.04, rupees_per_100_average_mpce=47.04, category_mpce_rs=1939 and total_mpce_rs=4122. The published share is retained directly rather than recalculated from rounded whole-rupee fields.
Sources & reuse
Original sources
- MoSPI / NSO, HCES 2023–24 Fact Sheet, Statement 4 (printed p8)
- HCES Section I and imputation definitions (printed pp3–4)
- Official MoSPI copyright policy
- GSDD 2026, Category A: A.3.1 and 5.7.1
Prominent source credit: MoSPI / NSO, Government of India, HCES 2023–24 Fact Sheet, Statement 4, printed page 8 (PDF page 9). Section I definitions are on printed pages 3–4 (PDF pages 4–5). The download preserves all 24 source rows and the offline package includes the original unchanged factsheet PDF.
The official copyright policy allows accurate reproduction and allows NSO / MoSPI Category A datasets to be accessed, reproduced, redistributed, adapted and reused for commercial or noncommercial purposes, with appropriate attribution and other applicable legal conditions. The source must be prominently acknowledged wherever the material is published or issued to others. Permission does not cover material identified as third-party copyright; authorization must come from the applicable holder.
GSDD 2026 A.3.1 explicitly includes NSS reports and factsheets in Category A; clause 5.7.1 provides access free without registration. No CC0, GODL, Creative Commons or public-domain designation is assigned, and no official endorsement is implied.
Full source-reuse conditions · Complete method and offline reproduction notes