What the chart shows
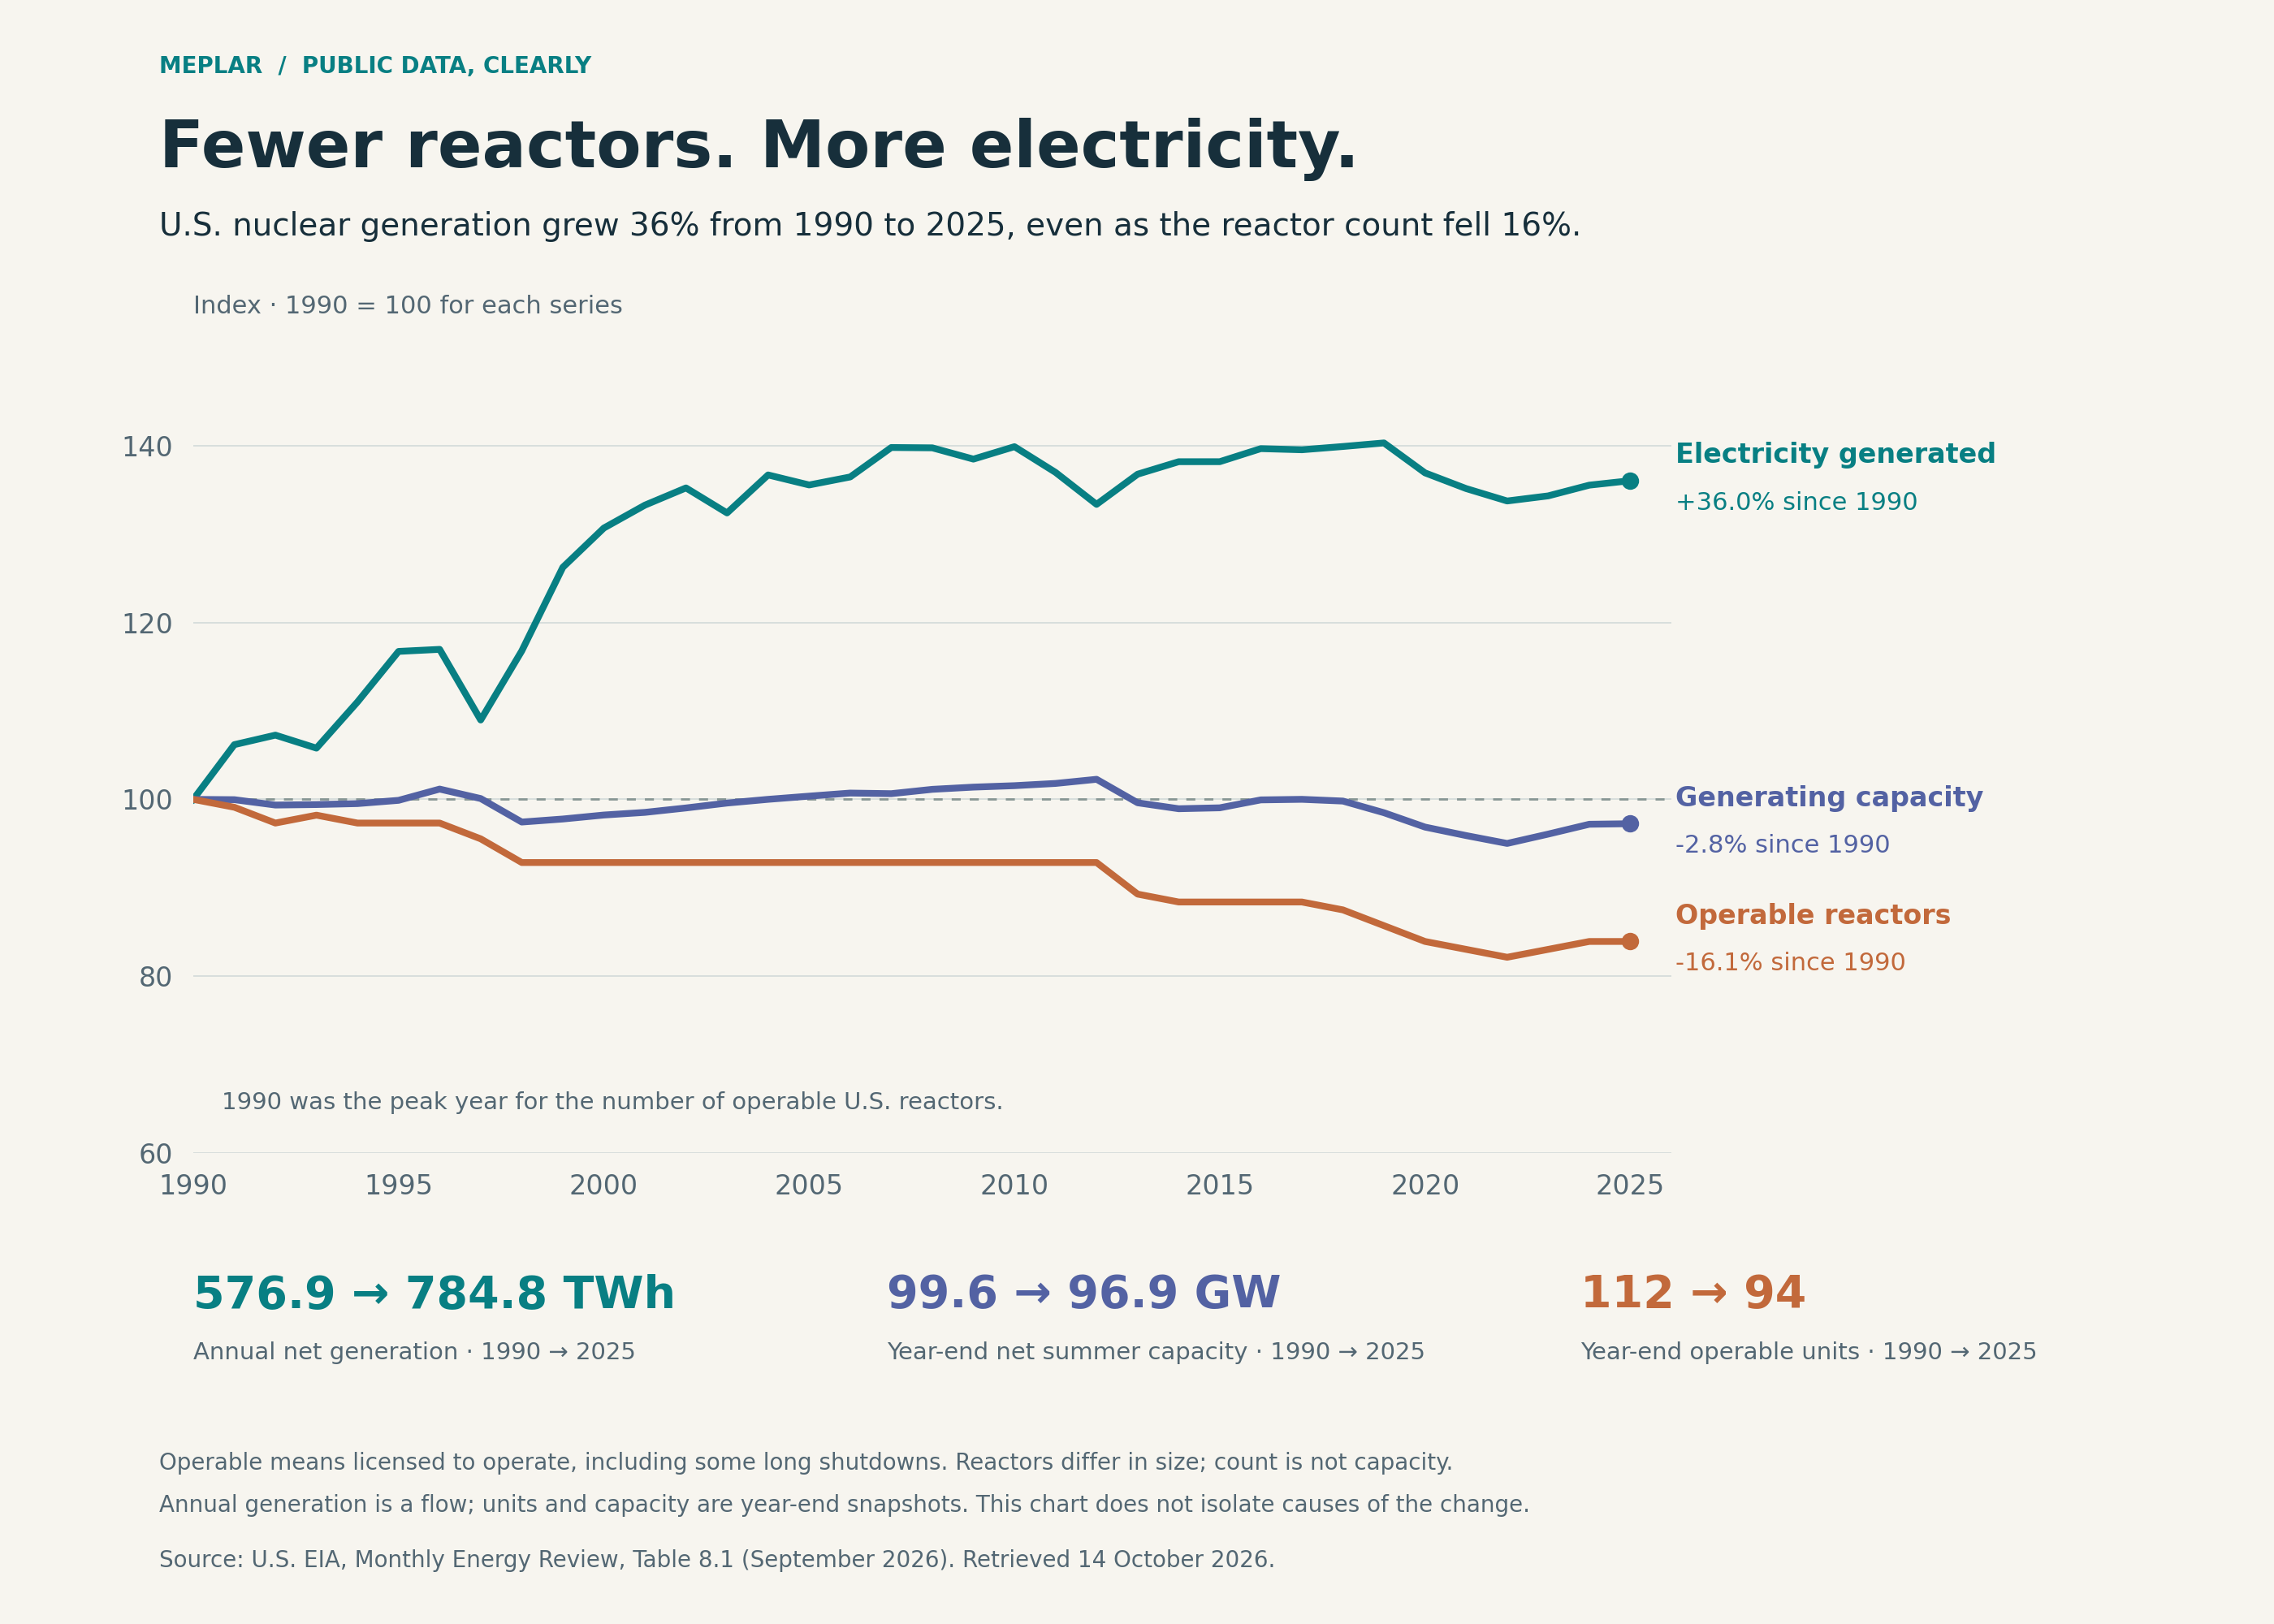
US nuclear generation rose 36.0% between 1990 and 2025 while the year-end operable-unit count fell from 112 to 94.
Annual net generation increased from 576.862 to 784.781 TWh. Year-end net summer capacity declined 2.8%, and operable units declined 16.1%. Units differ in size, so the reactor count is not a measure of generating capability.
50 US states and Washington, DC; chart 1990–2025; full annual series 1957–2025.
How it was made
Select EIA annual records with YYYYMM ending in 13; do not sum monthly rows. Keep all 69 annual rows and chart every year 1990–2025. Divide each series by its own 1990 value and multiply by 100. The 1990 baseline is the maximum year-end unit count in the full series.
Definitions & limits
- Operable units include some long shutdowns; the count is not the number generating throughout the year.
- Generation is an annual flow; units and net summer capacity are year-end snapshots. The chart does not establish causes of the change.
- Partial 2026 data are excluded. Missing source values remain empty; no interpolation or outlier deletion is used.
- The uncharted EIA capacity-factor series changes methodology in 2008. EIA can revise published figures.
Original sources
Snapshot date: 2026-10-14. Source releases and observations can be revised; the linked download notes describe this fixed version.