Australia / Economy / Dataset
State loan sizes, quarter by quarter.
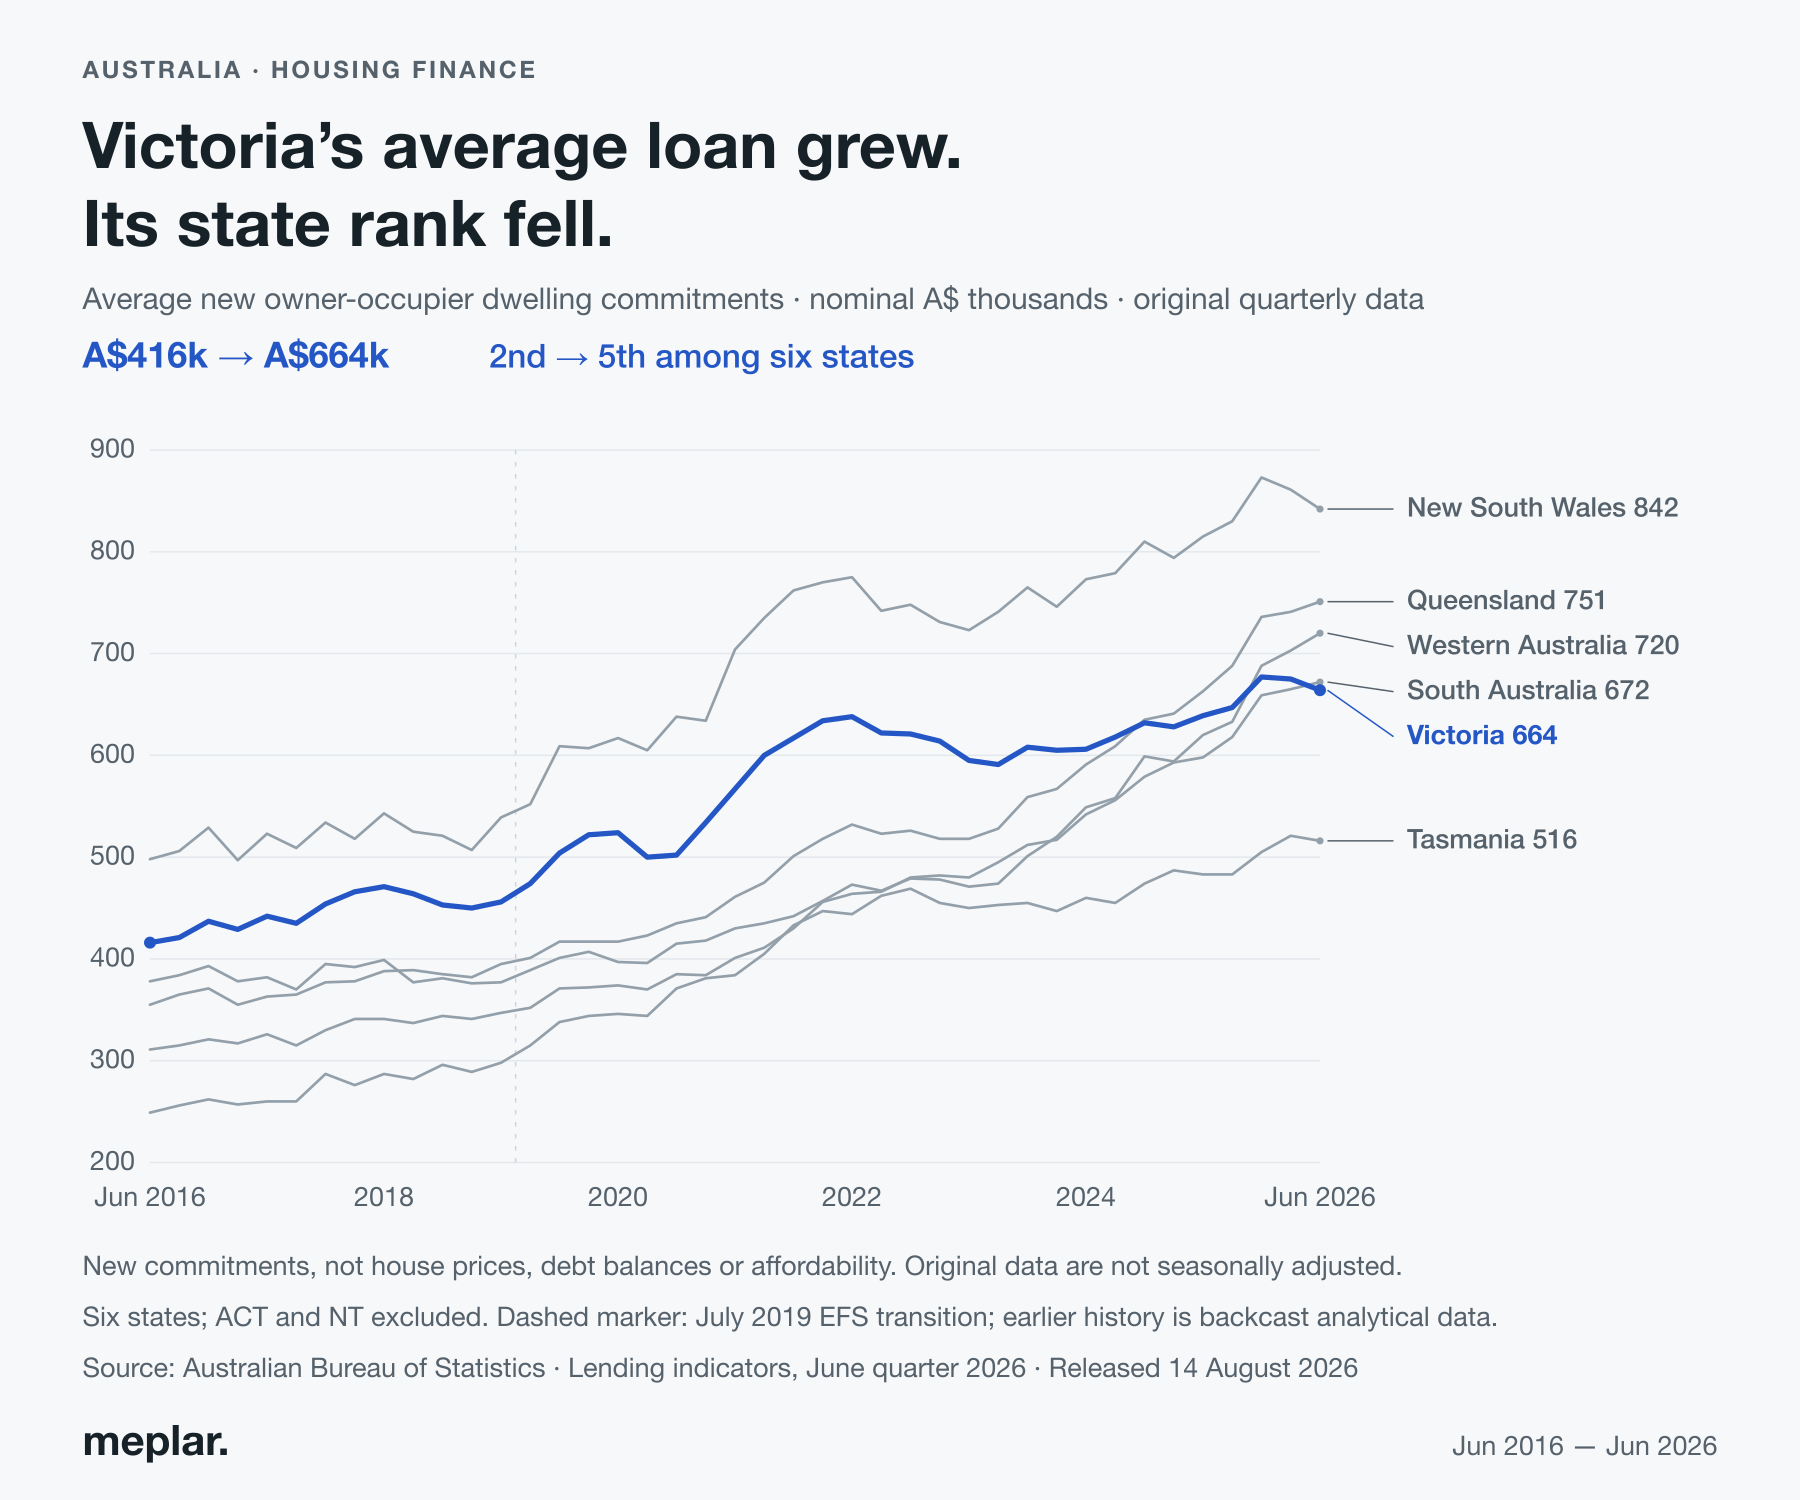
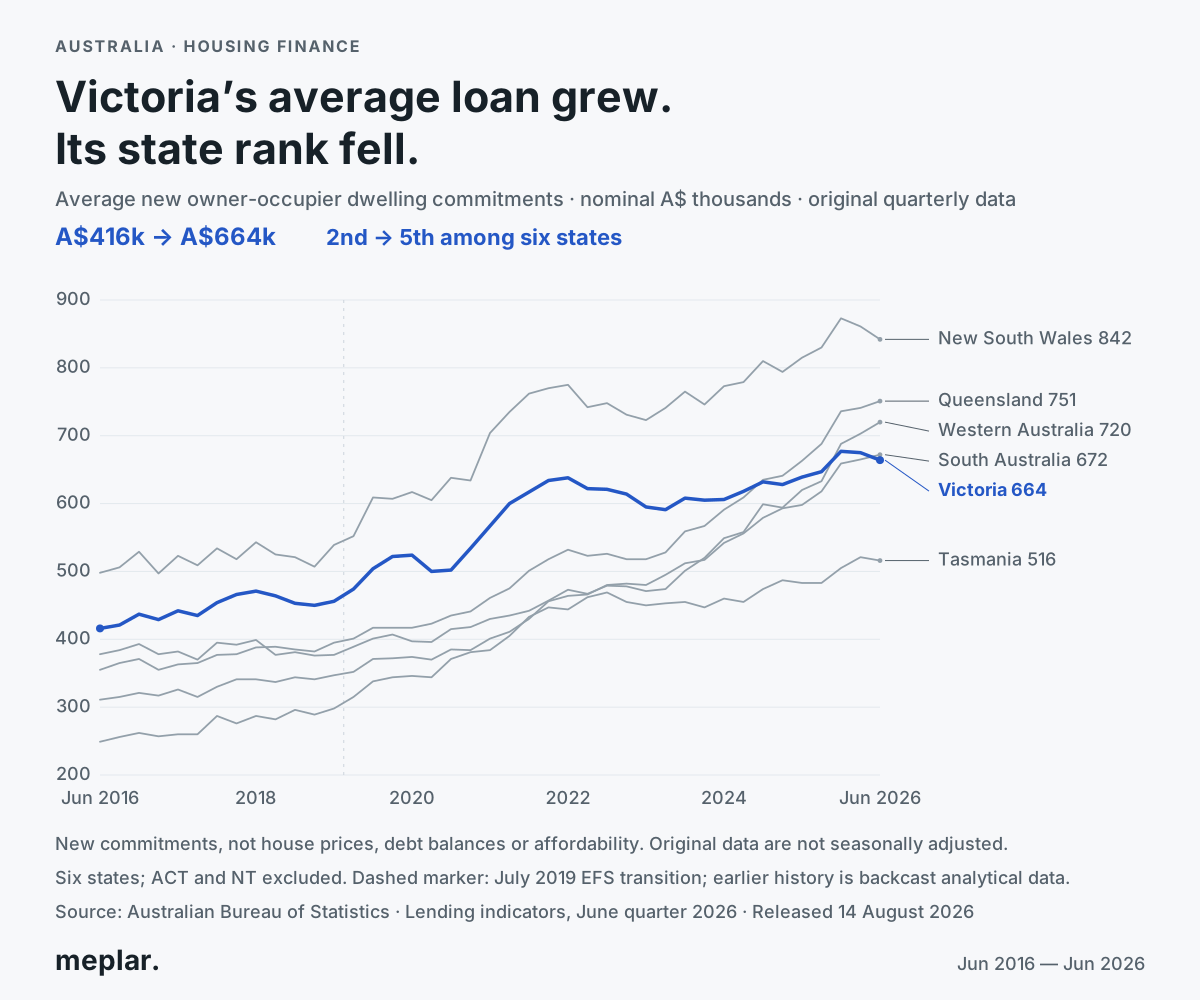
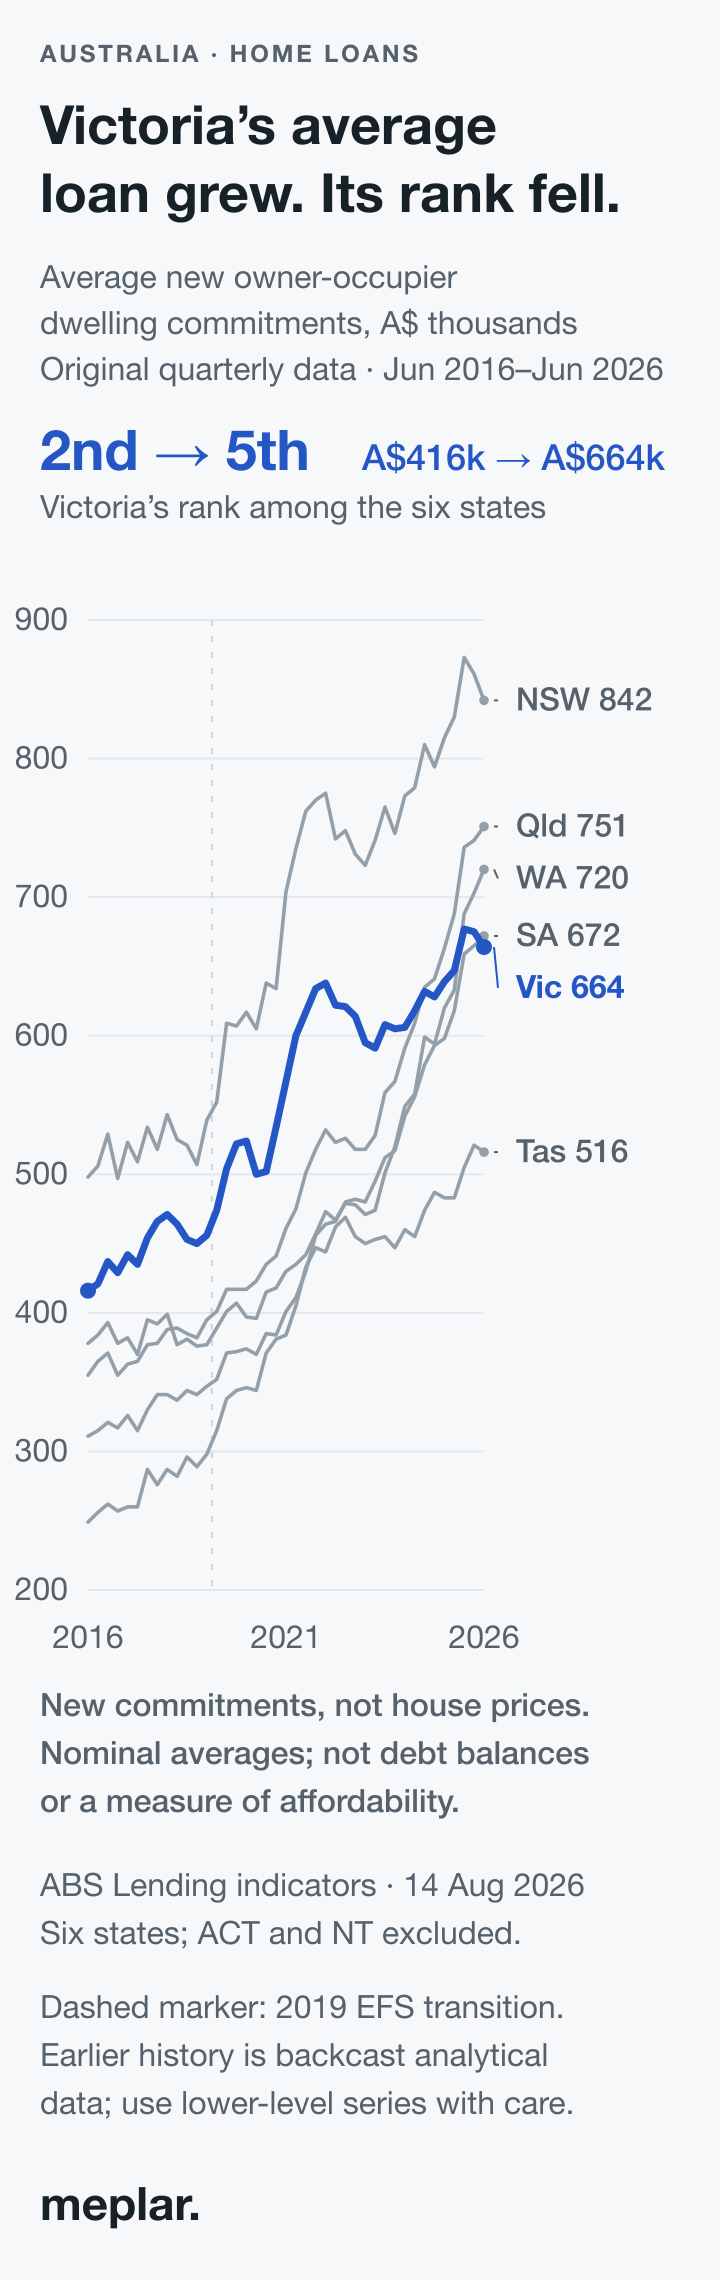
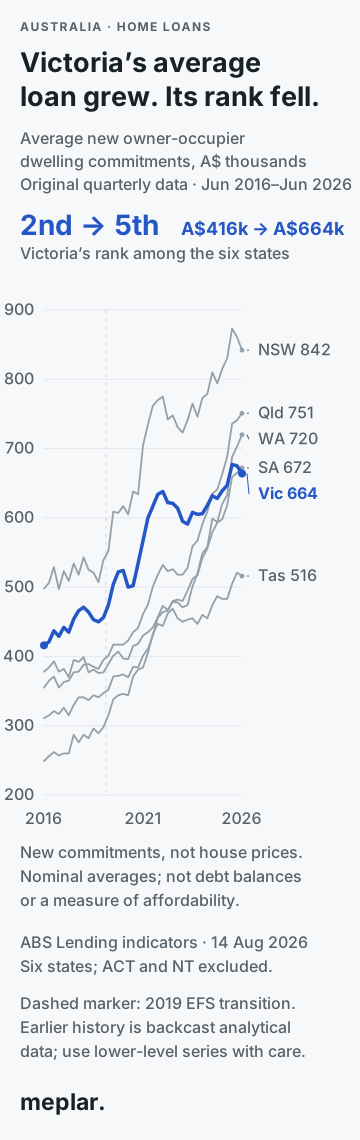
Published original average new owner-occupier dwelling loan commitments, June quarter 2016–June quarter 2026, in nominal A$ thousands. Includes all nine source geographies, a six-state chart extract and explicit six-state rankings.
Methods and limits
Source: Australian Bureau of Statistics, Lending indicators, June Quarter 2026. The “Average loan sizes for owner occupier dwellings, original, by state” table supplies 41 quarterly averages per geography, from June quarter 2016 through June quarter 2026. Values are nominal Australian dollars in thousands, retained at published precision. The source release is 14 August 2026; our frozen captures were retrieved on 22 October 2026.
The chart selects NSW, Victoria, Queensland, South Australia, Western Australia and Tasmania. It ranks each quarter’s six values from largest to smallest. Australia, the Northern Territory and the Australian Capital Territory are retained in the source extract but excluded from the chart and its six-state rankings. Equal values share a rank. The original averages are copied directly; we do not calculate a new quarterly mean or splice historical releases.
The ABS methodology describes borrower-accepted new commitments, rather than outstanding debt. Dwelling commitments exclude refinancing and cover construction and the purchase of new or existing dwellings; residential land and alterations/additions are separate. Original data are not seasonally adjusted.
ABS introduced its EFS collection in July 2019. Where concepts were sufficiently similar, earlier historical series were backcast using the parallel collection period. ABS describes earlier lower-level series as modelled analytical history to be used with caution. The dashed chart marker indicates that transition, not an asserted statistical break.
These are nominal loan commitment averages, not house prices, outstanding loan balances, affordability or an account of causes. Changes in borrower and dwelling mix can change averages. Rank is relative: Victoria’s published average increased between the endpoints even though its position fell.
The June 2026 ACT value is A$666k, slightly above Victoria’s A$664k. Including territories would change the ranking universe; this chart explicitly compares only the six states.
Data fields and files
| Field | Meaning |
|---|---|
quarter | Quarter-ending YYYY-MM; March, June, September or December. |
geography | Published source label; Australia, six states, NT or ACT. |
average_loan_aud_thousands | Published original new owner-occupier dwelling loan average, in nominal A$ thousands. |
rank_among_six_states | Descending competition rank among NSW, Vic, Qld, SA, WA and Tas only; equal values share a rank. |
source-extract.csv is long-form data: 369 rows across all nine geographies. chart-data.csv has 41 rows and six state columns, labelled in A$ thousands. state-ranks.csv contains 246 state-quarter rows and explicit six-state ranks. endpoints.csv holds the six June 2016 and June 2026 comparisons.
Files and reproducibility
Unzip the package and run python3 reproduce.py. The script uses only the Python standard library, rebuilds all four CSVs exactly and checks table values against the same frozen release’s embedded chart JSON. Frozen SVG and PNG exports are supplied; this script does not recreate PNG rendering.
- README.md · text/markdown · 2,570 bytes
- SHA256SUMS.txt · text/plain · 1,139 bytes
- SOURCE_PROVENANCE.json · application/json · 11,772 bytes
- SOURCE_TERMS.txt · text/plain · 801 bytes
- chart-data.csv · text/csv · 1,918 bytes
- chart.png · image/png · 317,224 bytes
- chart.svg · image/svg+xml · 10,833 bytes
- chart_mobile.png · image/png · 279,571 bytes
- chart_mobile.svg · image/svg+xml · 11,017 bytes
- endpoints.csv · text/csv · 198 bytes
- metadata.json · application/json · 2,446 bytes
- reproduce.py · text/x-python · 5,194 bytes
- source-and-data.zip · application/zip · 725,023 bytes
- source-extract.csv · text/csv · 6,810 bytes
- state-ranks.csv · text/csv · 4,901 bytes
Original sources and reuse
- ABS Lending indicators, June Quarter 2026
- ABS methodology, including historical backcasting
- ABS copyright and Creative Commons policy
Source data are © Commonwealth of Australia, Australian Bureau of Statistics, supplied under CC BY 4.0 subject to the agency’s stated exceptions. Attribute ABS for the source data and Meplar for extraction and visualisation. No rights to ABS logos, the Commonwealth Coat of Arms or the Meplar brand are granted by the data license. See source terms and capture provenance.